Fig. 11.
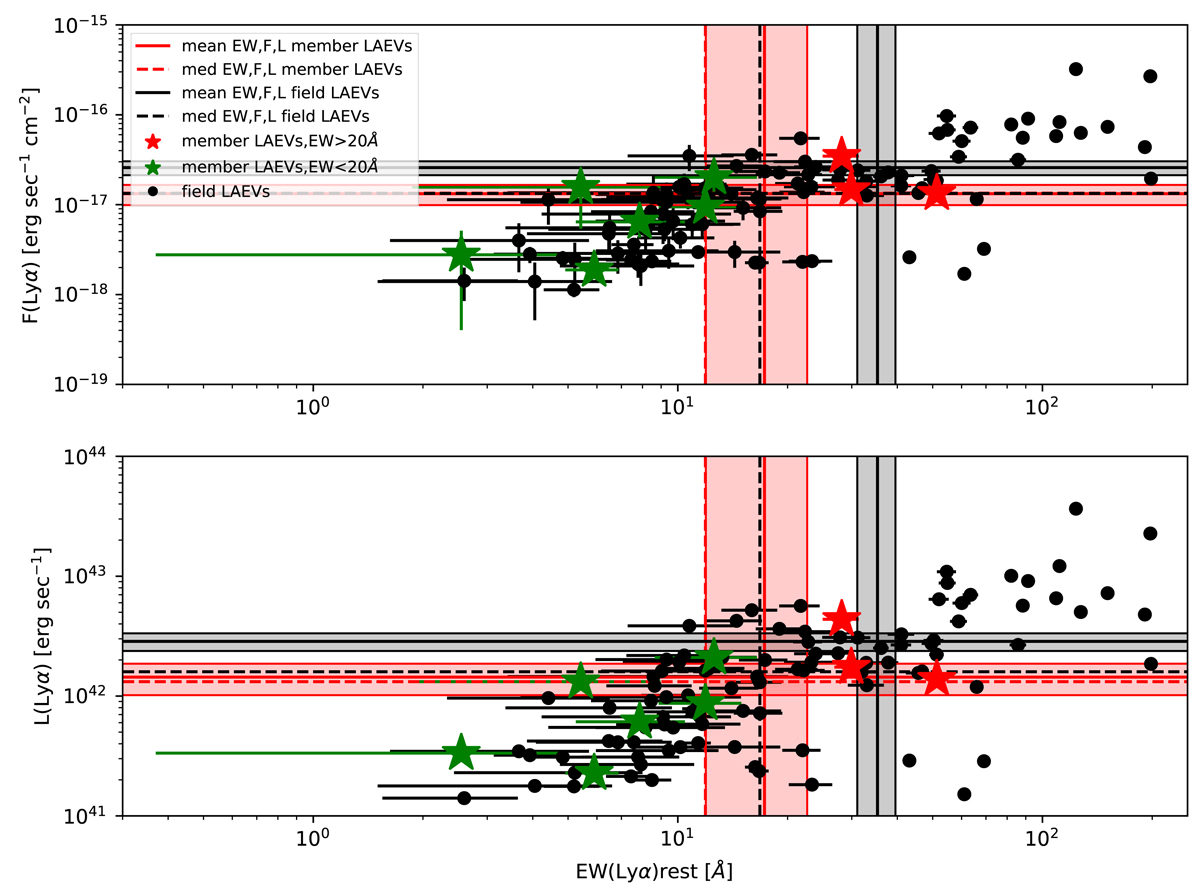
Upper panel: Lyα flux vs Lyα equivalent width. lower panel: Lyα luminosity vs Lyα equivalent width. Green (red) stars indicate LAEVs in the identified overdensities with EW(Lyα) < 20 Å (EW(Lyα) > 20 Å), black dots indicate the LAEVs in the field. The vertical lines correspond to the mean (solid) and median (dashed) values of the EW(Lyα) of LAEVs in overdensities (red) and in the field (black). The horizontal lines correspond to the mean (solid) and median (dashed) values of the F(Lyα) and L(Lyα) of the LAEVs in the detected overdensities (red) and in the field (black). The shaded areas indicate the standard deviation of the means. The mean and median values of the F(Lyα) of the LAEVs in the detected overdensities and the median value of the F(Lyα) of the LAEVs in the field overlap. The mean and median values of the L(Lyα) is 1.4 ± 0.4 × 1042 and 1.3 × 1042 erg sec−1 for the LAEVs in the detected overdensities, while they are 2.9 ± 0.5 × 1042 and 1.6 × 1042 erg sec−1 for the LAEVs in the field. The median value of the LAEVs in the identified overdensities with EW(Lyα) < 20 Å (> 20 Å) is 7.4 × 1041 erg sec−1 (1.7 × 1042 erg sec−1).
Current usage metrics show cumulative count of Article Views (full-text article views including HTML views, PDF and ePub downloads, according to the available data) and Abstracts Views on Vision4Press platform.
Data correspond to usage on the plateform after 2015. The current usage metrics is available 48-96 hours after online publication and is updated daily on week days.
Initial download of the metrics may take a while.