Fig. 1.
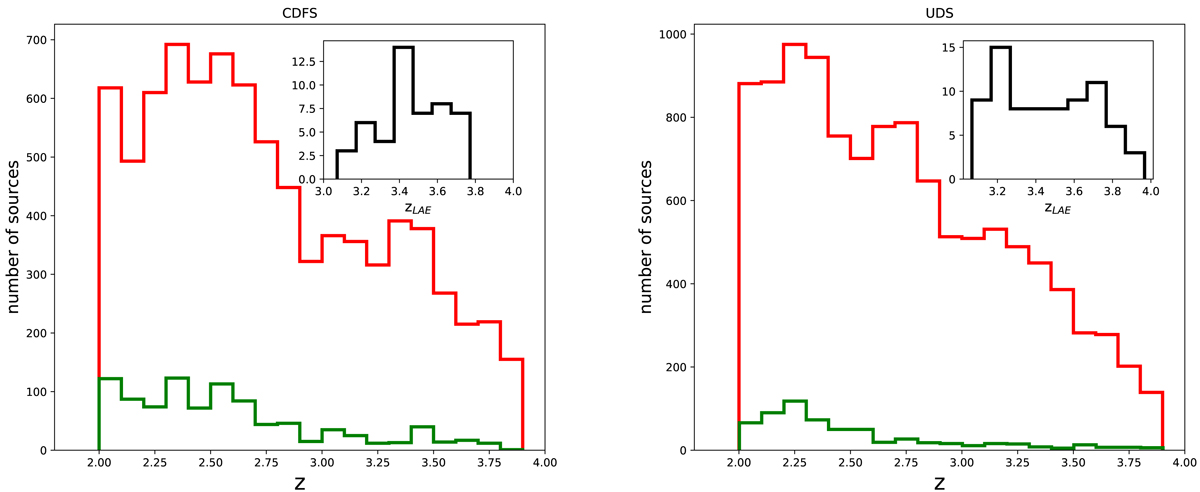
Redshift distribution of the sources in the input catalog of the CDFS (left panel) and of the UDS (right panel). The red histograms represent the sources with photometric and spectroscopic redshifts, the green histograms the sources with spectroscopic redshifts from the literature. The inserts show the redshift distributions of the Lyα-emitting galaxies selected from the VANDELS database and used in this work.
Current usage metrics show cumulative count of Article Views (full-text article views including HTML views, PDF and ePub downloads, according to the available data) and Abstracts Views on Vision4Press platform.
Data correspond to usage on the plateform after 2015. The current usage metrics is available 48-96 hours after online publication and is updated daily on week days.
Initial download of the metrics may take a while.