Fig. 9
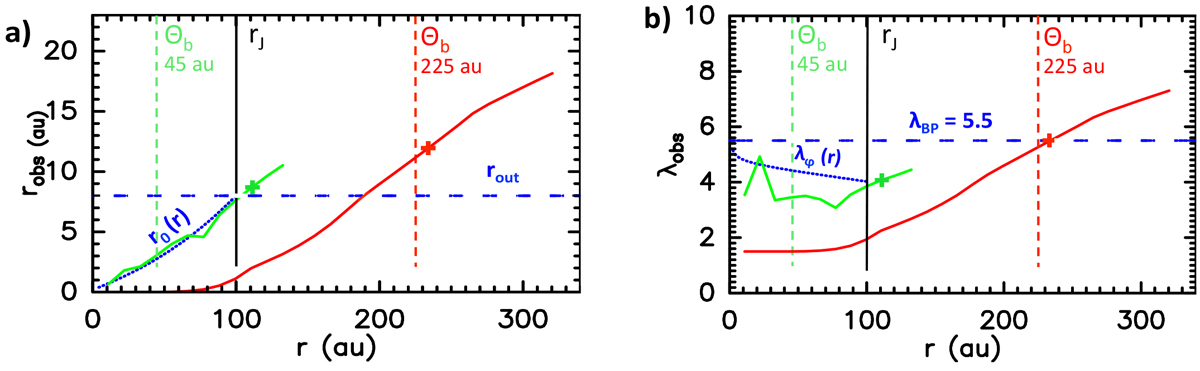
Examples of bias when using the rotation curve method for a representative model at i = 40° (in red in Fig. 8): “Observed” launch radii robs(r) (a) and magnetic lever arms λobs(r) (b) inferred at each r by application of Anderson’s formula to jobs(r) and Vp,obs(r) (Eqs. (25) and (26)). Green curves illustrate the spatially resolved regime (θb = 45 au) and red curves the unresolved regime (θb = 225 au). These curves stop at 1% of the PV peak intensity, with a plus symbol marking 10%. The black vertical line shows the flow radius rj. For comparison, dotted blue curves plot the true launch radii r0(r) (a) and λϕ(r) (b) of each DW streamline tangent to r; horizontal dashed blue lines mark the true outermost launch radius rout = 8 au (a) and true λBP = 5.5 (b) in the model. Other model parameters are: MHD solution L5W17, α = −2, M⋆ = 0.1 M⊙, and rin = 0.25 au.
Current usage metrics show cumulative count of Article Views (full-text article views including HTML views, PDF and ePub downloads, according to the available data) and Abstracts Views on Vision4Press platform.
Data correspond to usage on the plateform after 2015. The current usage metrics is available 48-96 hours after online publication and is updated daily on week days.
Initial download of the metrics may take a while.