Fig. 8
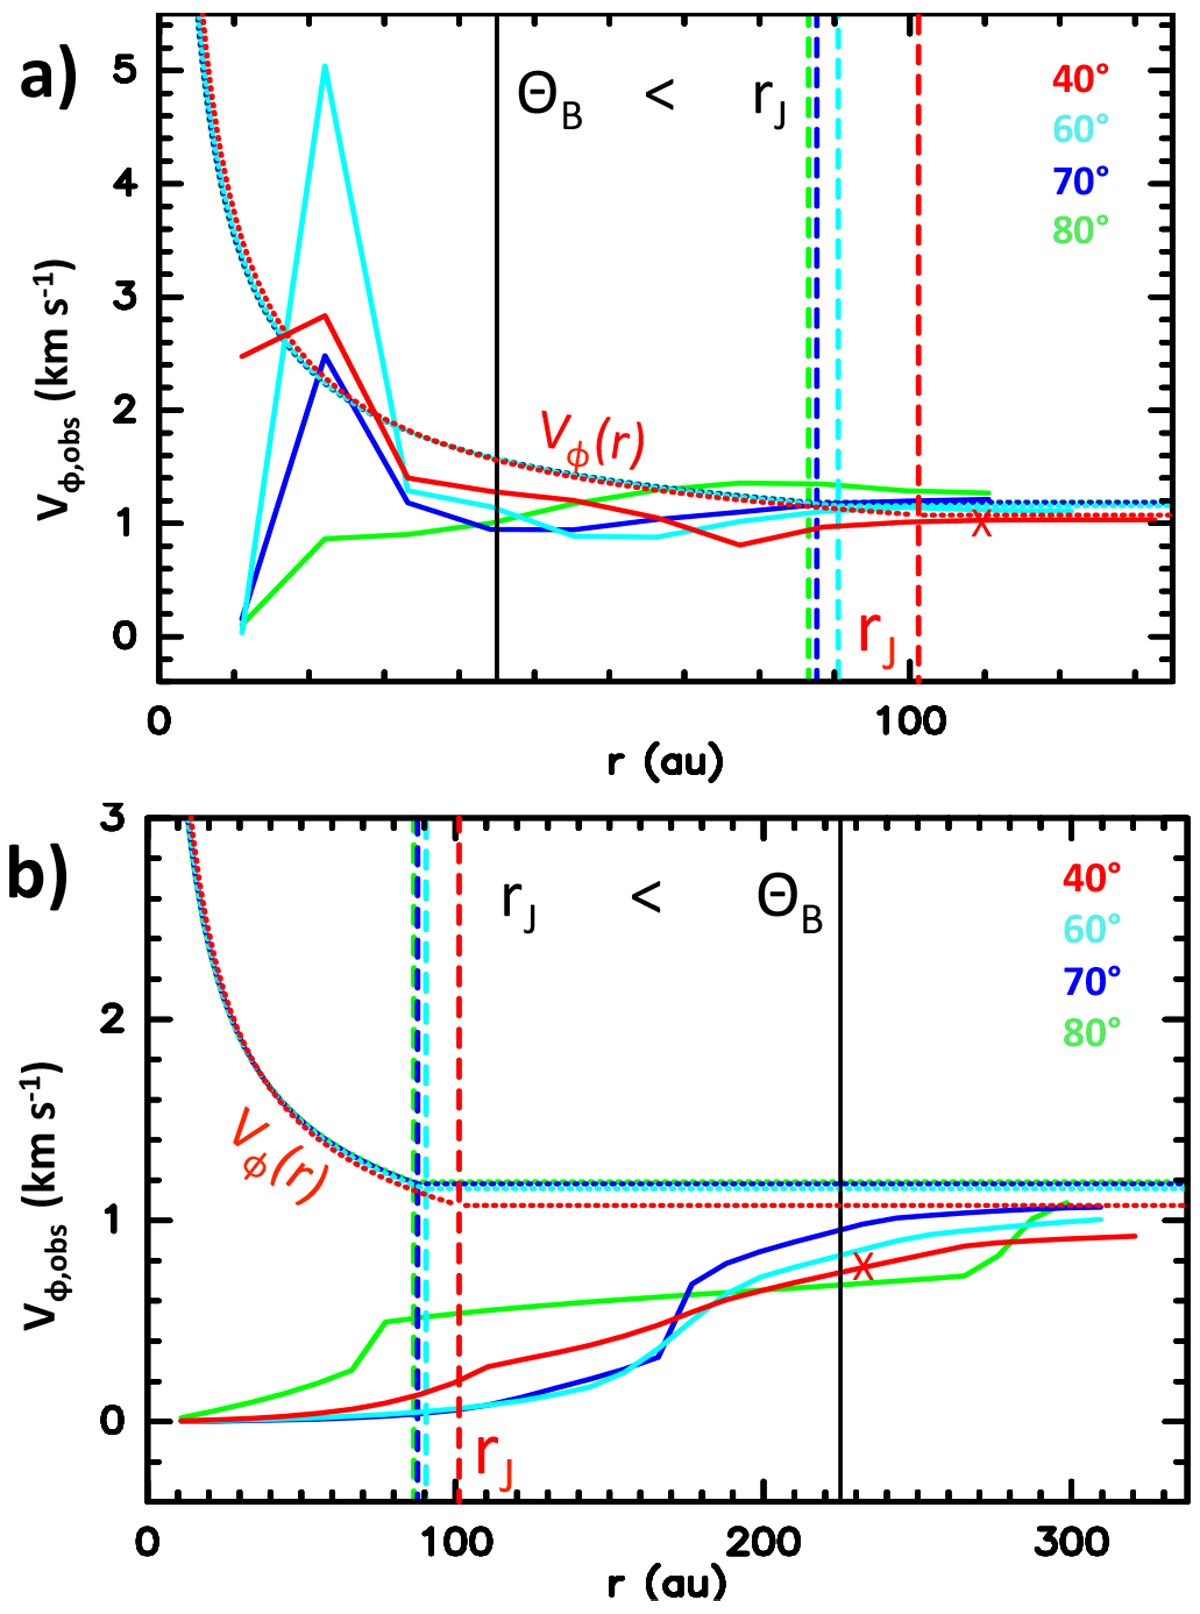
“Observed” rotation curve Vϕ,obs(r) obtained from the difference of peak velocity between ± r from the jet axis (Eq. (16)) for our reference model viewed at i = 40°, 60°, 70°, and 80° (color-coded curves). (a): Spatially resolved regime (θb = 45 au), (b): spatially unresolved regime (θb = 225 au; we note the change of scales on both axes). In both panels, a vertical black line indicates the beam FWHM, and colored vertical dashed lines indicate the flow radius rj at zcut = 225 au. The true wind rotation curve Vϕ(r) at z = zcut∕sin i) is shown by dotted curves, with a constant value beyond rj. The cross on the red curve illustrates where the local intensity drops below 10% of the PV peak.
Current usage metrics show cumulative count of Article Views (full-text article views including HTML views, PDF and ePub downloads, according to the available data) and Abstracts Views on Vision4Press platform.
Data correspond to usage on the plateform after 2015. The current usage metrics is available 48-96 hours after online publication and is updated daily on week days.
Initial download of the metrics may take a while.