Fig. 4
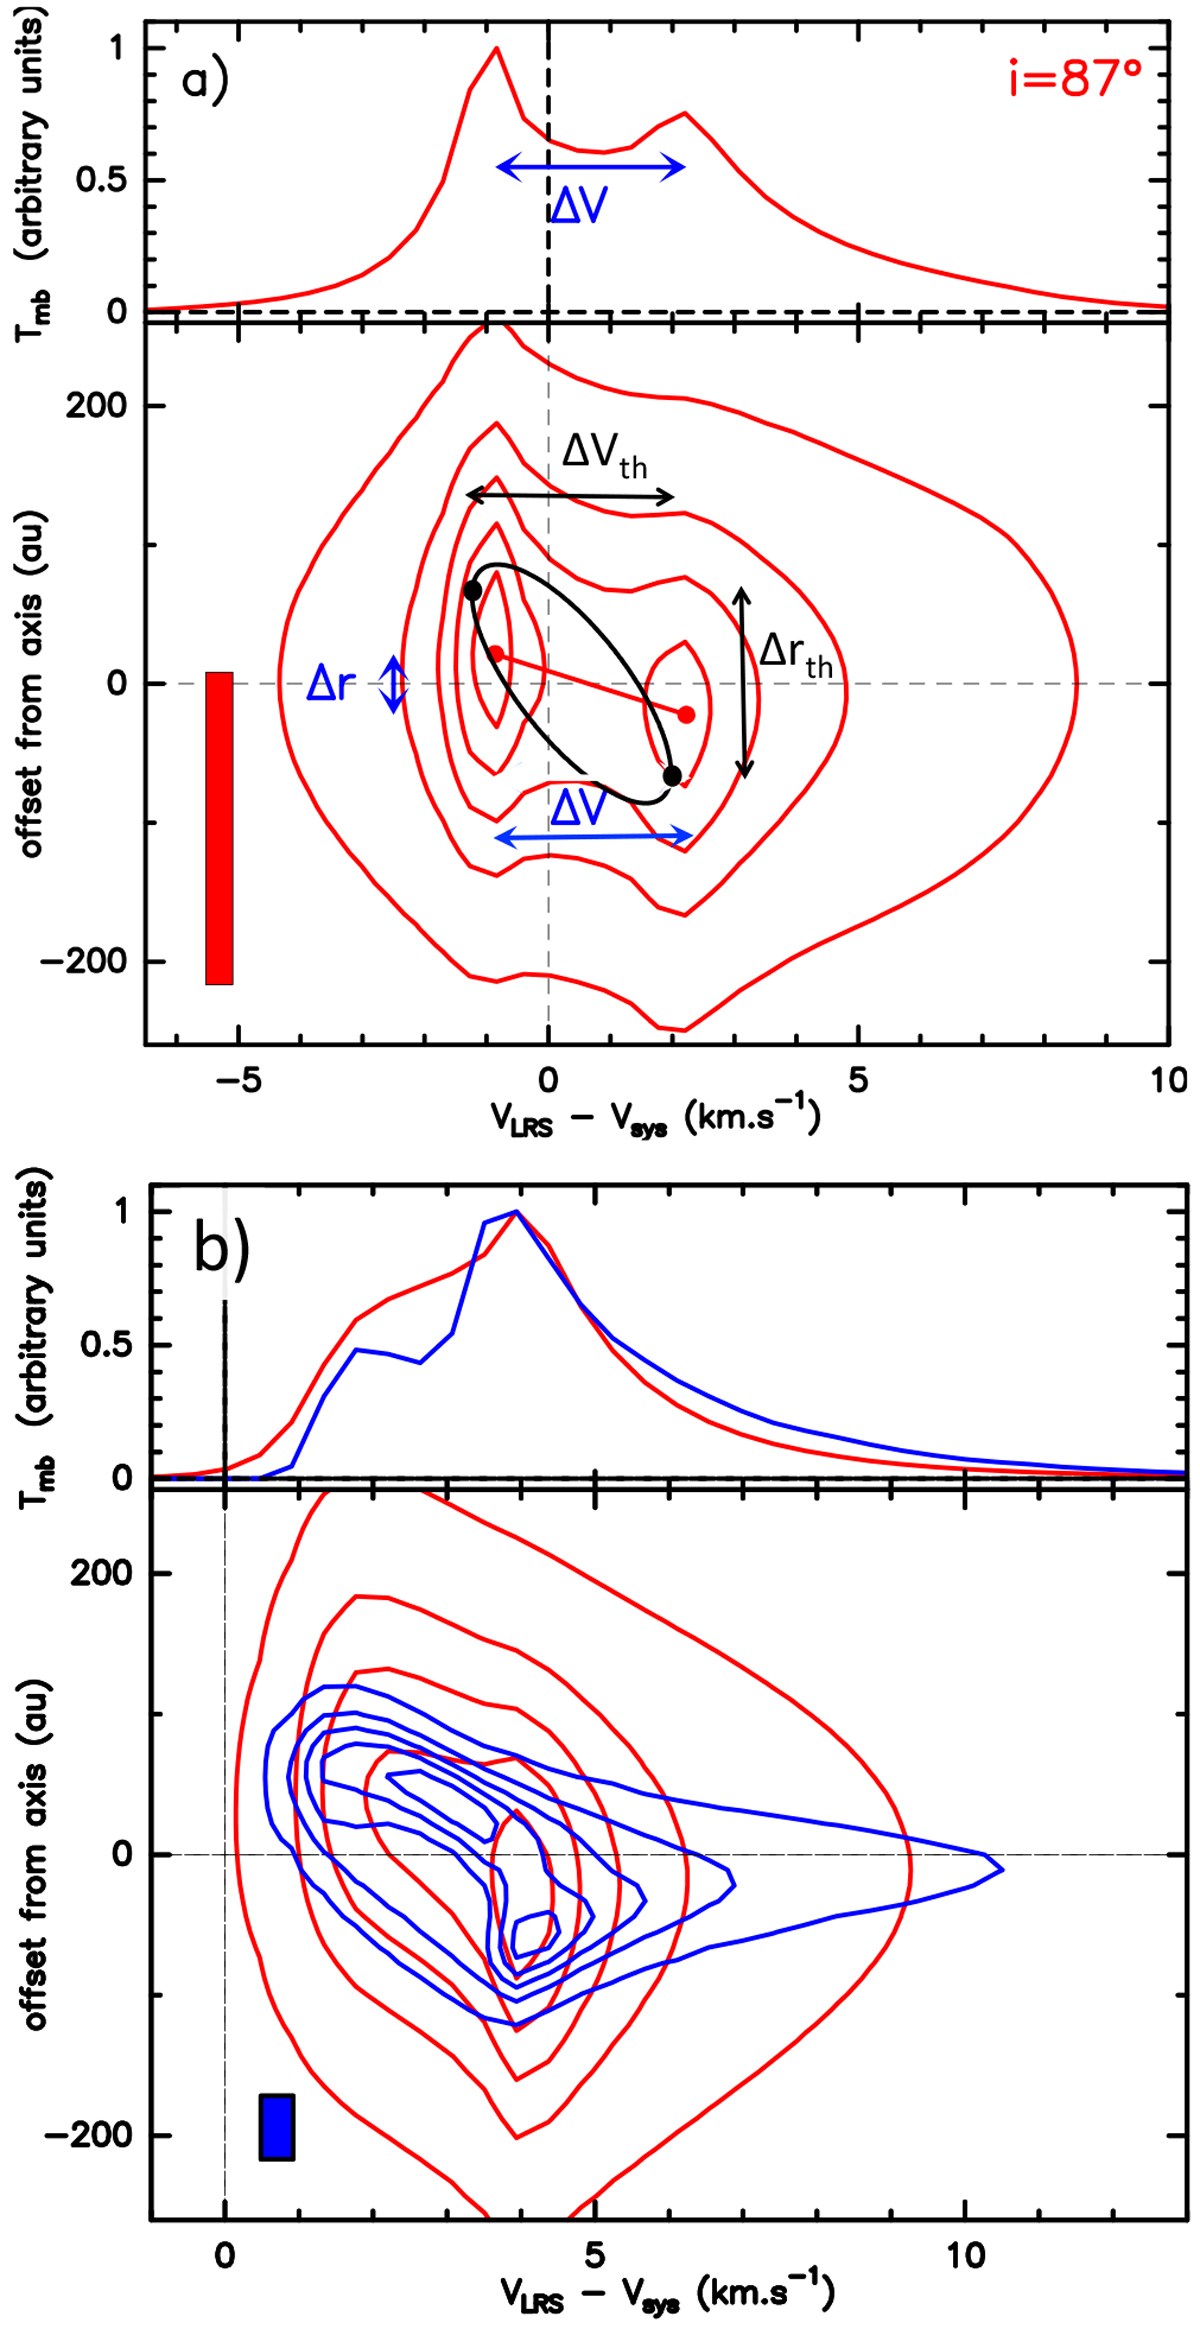
a: on-axis spectrum and transverse PV diagram for the reference model viewed at i = 87°, illustratingthe “edge-on” case. The two red dots indicate the intensity peaks in the PV, which have opposite velocity signs in this configuration; their connecting line defines the spatial and velocity separations Δr and ΔV used to estimate the observed specific angular momentum jobs in Eq. (15). We also plot in black the ellipse and peak positions contributed by the outermost streamline alone, which predict a similar velocity shift ΔVth (see Eq. (13)) but a much larger spatial shift Δrth (see Eq. (12)). Other model parameters are: zcut = 225 au, M* = 0.1 M⊙, rin = 0.25 au, rout = 8 au, α = − 2, and θb = 225 au. Filled rectangles show the spectral and angular resolutions. b: same as (a) but at lower inclination i = 70° (note the change in velocity scale) for α = 0 and θb = 225 au (red) and 45 au (blue). Double-peaks in the PV diagram now have the same velocity sign, and can vanish at moderate angular resolution.
Current usage metrics show cumulative count of Article Views (full-text article views including HTML views, PDF and ePub downloads, according to the available data) and Abstracts Views on Vision4Press platform.
Data correspond to usage on the plateform after 2015. The current usage metrics is available 48-96 hours after online publication and is updated daily on week days.
Initial download of the metrics may take a while.