Fig. 12
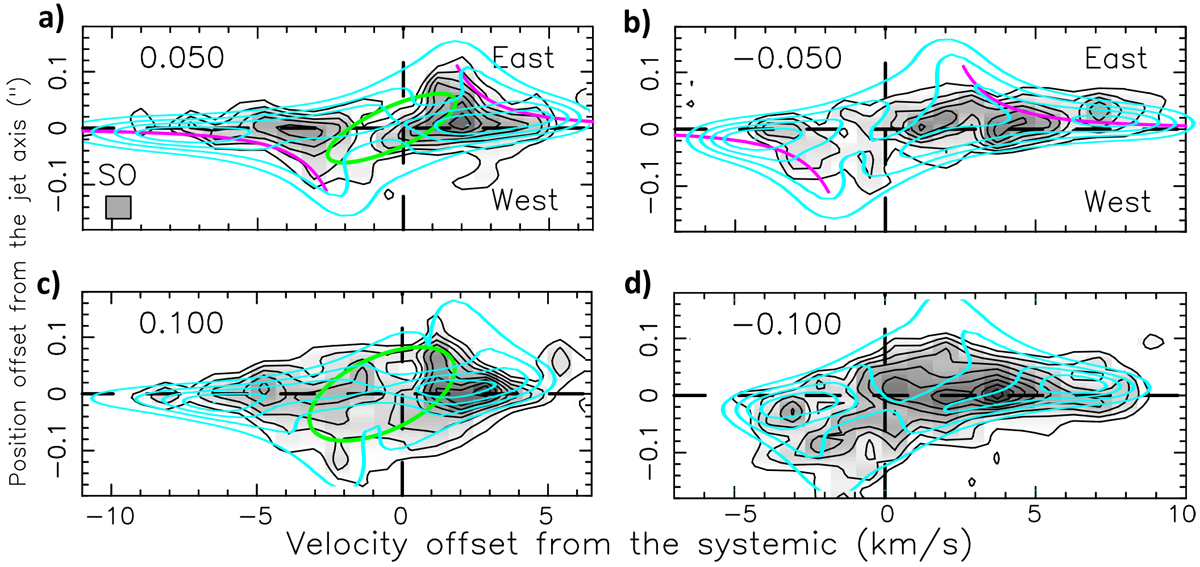
Position–velocity cuts at 0.04′′ ≃ 18 au resolution across the upper disk atmospheres in HH212: black contours and grayscale show SO ALMA observations from Lee et al. (2018a). Cyan contours show synthetic predictions for the MHD DW model of Tabone et al. (2017). zcut is labeled in arcsec in the upper-left corner (>0 in the blue lobe, <0 in the red lobe). Magenta curves in panels a and b plot Keplerian curves fitted by Lee et al. to their data at z ≃ ± 20 au; the blue andred velocity shift of these curves from the systemic velocity suggests an outflow from the disk atmosphere out to rout ≃ 0.1′′≃ 45 au, well reproduced by the MHD DW model; green ellipses in panels a and c show the expanding shell model fitted by Lee et al. in theblue lobe.
Current usage metrics show cumulative count of Article Views (full-text article views including HTML views, PDF and ePub downloads, according to the available data) and Abstracts Views on Vision4Press platform.
Data correspond to usage on the plateform after 2015. The current usage metrics is available 48-96 hours after online publication and is updated daily on week days.
Initial download of the metrics may take a while.