Fig. 11
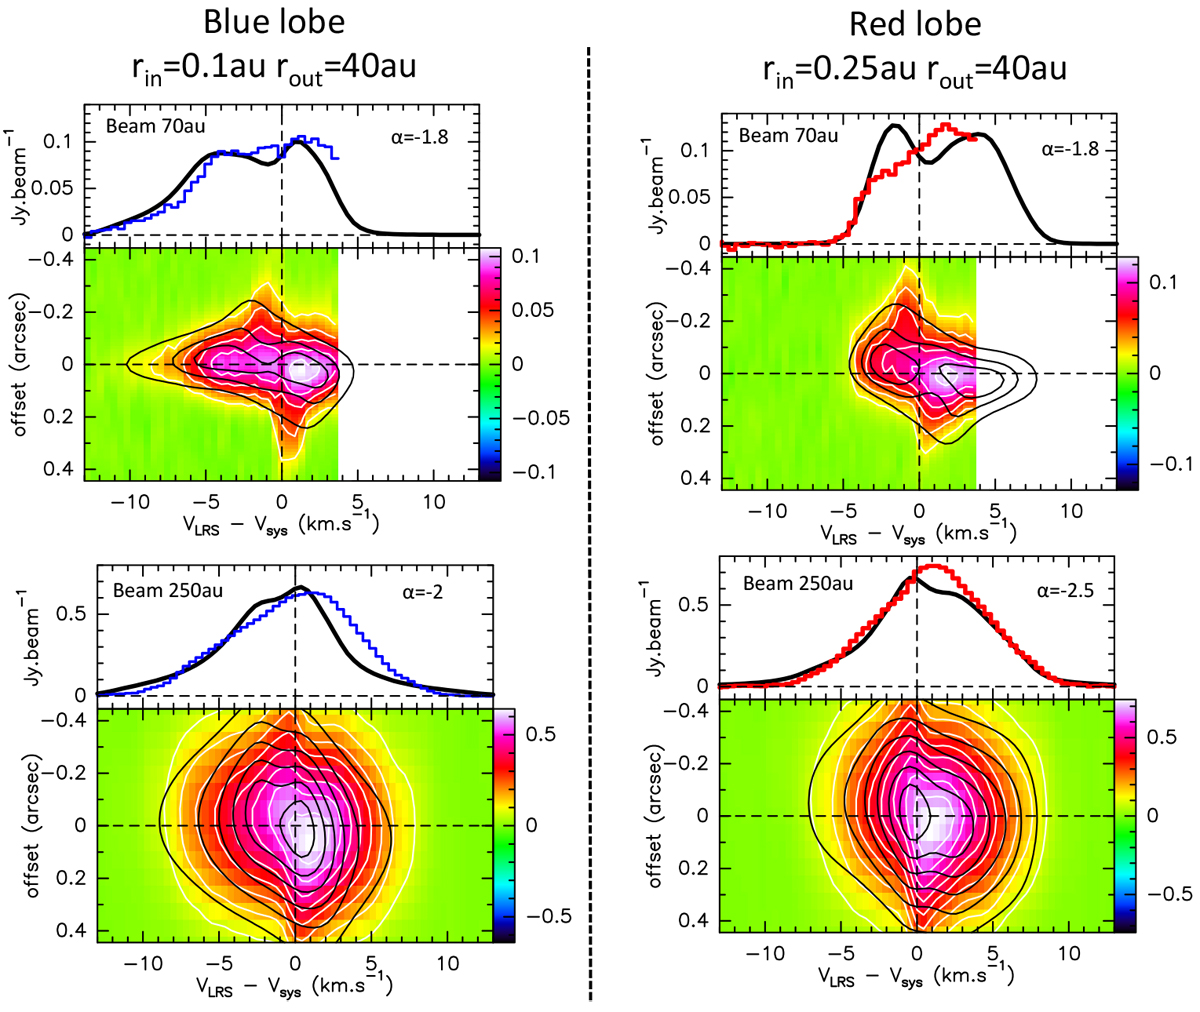
Comparison between observed and modeled SO on-axis spectra and transverse position-velocity cuts taken at ± 0.′′15 (70 au) across the blueshifted (left panels) and redshifted (right panels) lobes of the HH212 jet. Top row: ALMA Cycle 4 data (70 au beam) from Tabone et al. (2017). Bottom row: ALMA Cycle 0 data (250 au beam) from Podio et al. (2015). In all panels, observed spectra are plotted as histograms, and observed PV diagrams are shown as color maps with white contours. Synthetic predictions for the MHD DW model of Tabone et al. (2017), convolved by the appropriate beam size, are overplotted in black. The model uses the MHD DW solution L5W30, M⋆ = 0.2 M⊙, i = 87°, with the range of launch radii (rin, rout) indicated on top. The best-fitting emissivity variation index (α) is marked ineach panel.
Current usage metrics show cumulative count of Article Views (full-text article views including HTML views, PDF and ePub downloads, according to the available data) and Abstracts Views on Vision4Press platform.
Data correspond to usage on the plateform after 2015. The current usage metrics is available 48-96 hours after online publication and is updated daily on week days.
Initial download of the metrics may take a while.