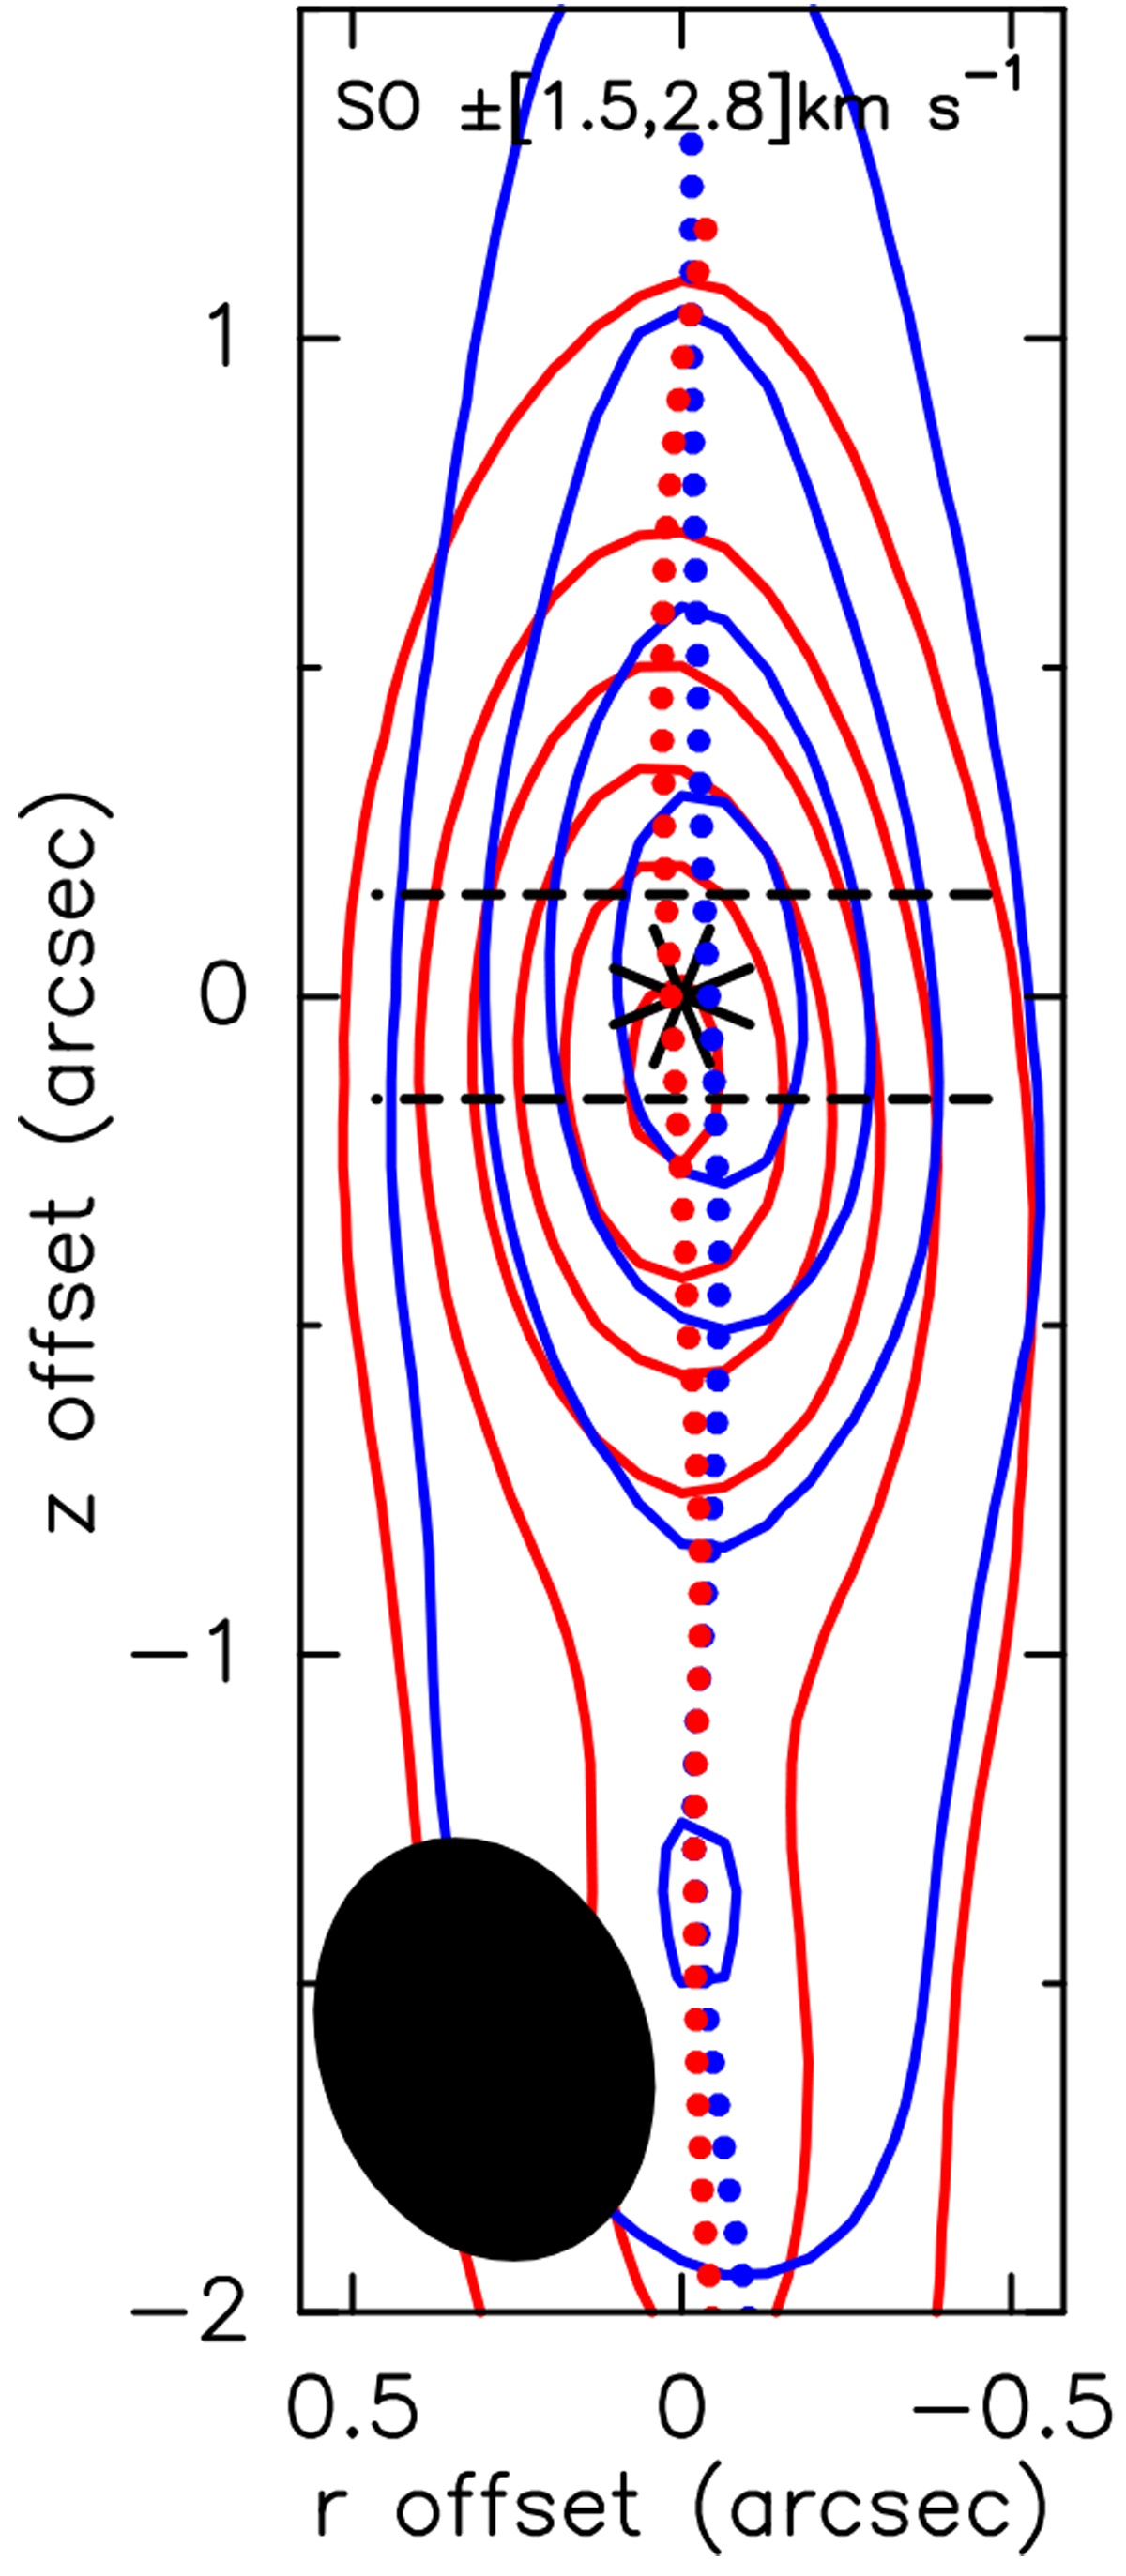
Fig. 10

Rotation signatures retrieved at 225 au resolution by spectro-astrometry towards the low-velocity HH212 outflow. Blue (resp. red) contours show SO(98−87) blueshifted (resp. redshifted) emission over intermediate velocities (1.5 km s−1 < ∣ VLSR − Vsys∣ < 2.8 km s−1) mapped with ALMA Cycle 0 (from Podio et al. 2015). The blue (resp. red) dots mark the centroid positions of transverse intensity cuts at each altitude across the blue (resp. red) contour maps. The black asterisk indicates the continuum peak. The jet was rotated to point upwards for clarity. Horizontal black dashed lines depict the position of PV cuts at z ± 70 au shown in Fig. 11. The clean beam FWHM of 0.65″ × 0.47″ is shown as afilled black ellipse. First contours are 0.1 mJy beam−1 km s−1 and steps are 0.15 mJy beam−1 km s−1.
Current usage metrics show cumulative count of Article Views (full-text article views including HTML views, PDF and ePub downloads, according to the available data) and Abstracts Views on Vision4Press platform.
Data correspond to usage on the plateform after 2015. The current usage metrics is available 48-96 hours after online publication and is updated daily on week days.
Initial download of the metrics may take a while.


