Fig. 1.
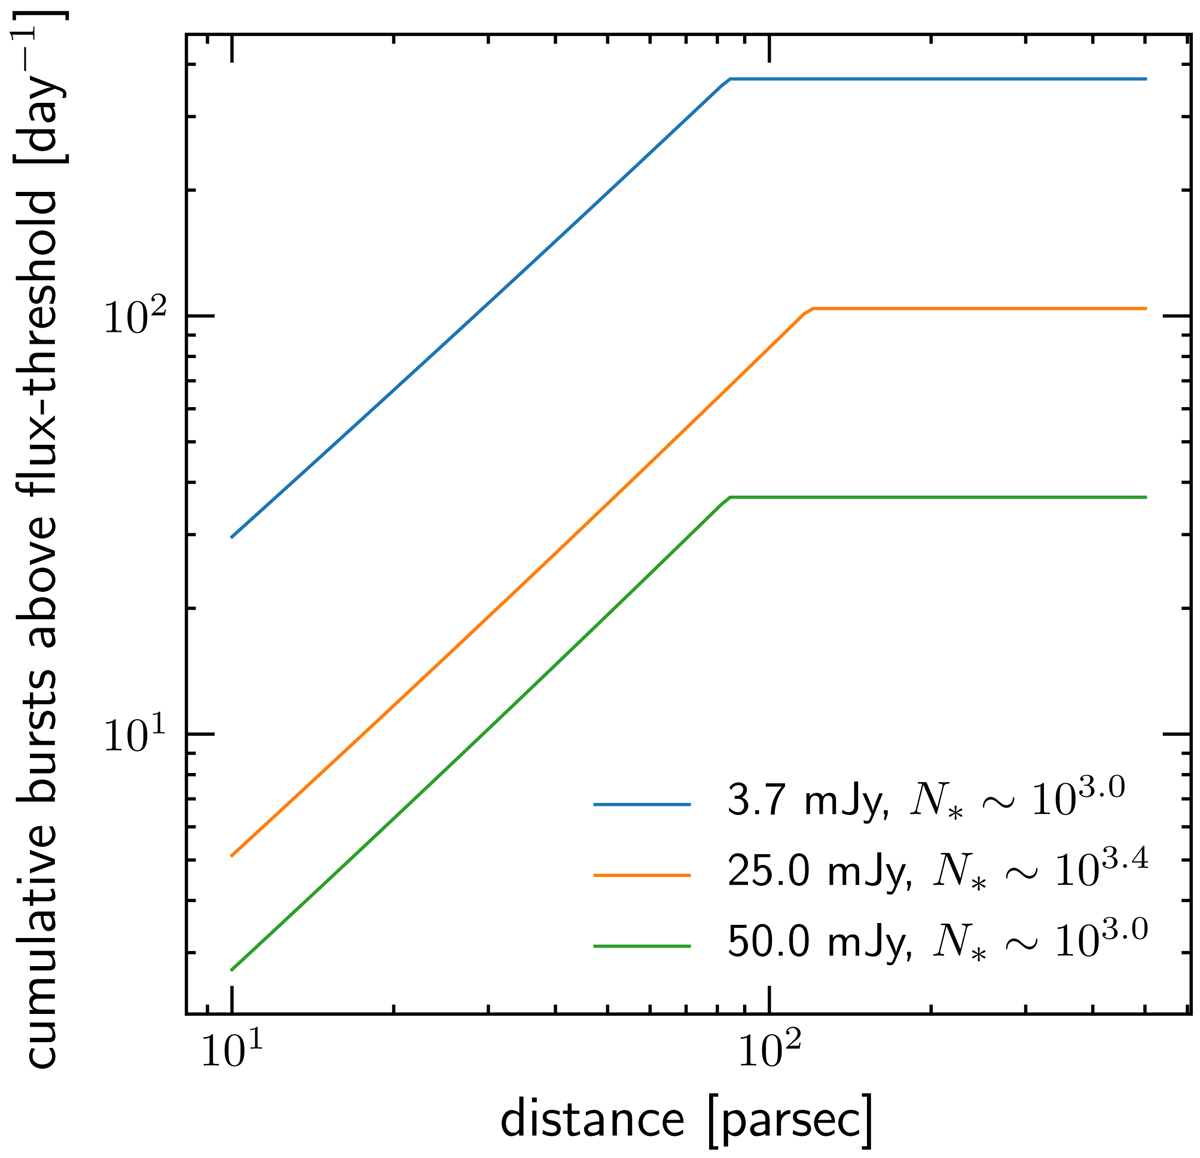
Expected all-sky rate of radio bursts at 150 MHz accompanying super-flares (E ≫ 1032 erg) from stars within a distance given by the x-axis values. The different curves correspond to the flux-sensitivity thresholds given in the legend. The thresholds correspond to the planned SKA-low sensitivity (blue), and current LOFAR sensitivity (optimistic in orange and conservative in green) in a 1 s integration and 40 MHz bandwidth, respectively. The break in the curves is at the sensitivity horizon, and is due to saturation of the emission process. The expected number of stars within the horizon contributing to the super-flares is also given in the legend.
Current usage metrics show cumulative count of Article Views (full-text article views including HTML views, PDF and ePub downloads, according to the available data) and Abstracts Views on Vision4Press platform.
Data correspond to usage on the plateform after 2015. The current usage metrics is available 48-96 hours after online publication and is updated daily on week days.
Initial download of the metrics may take a while.