Fig. 4.
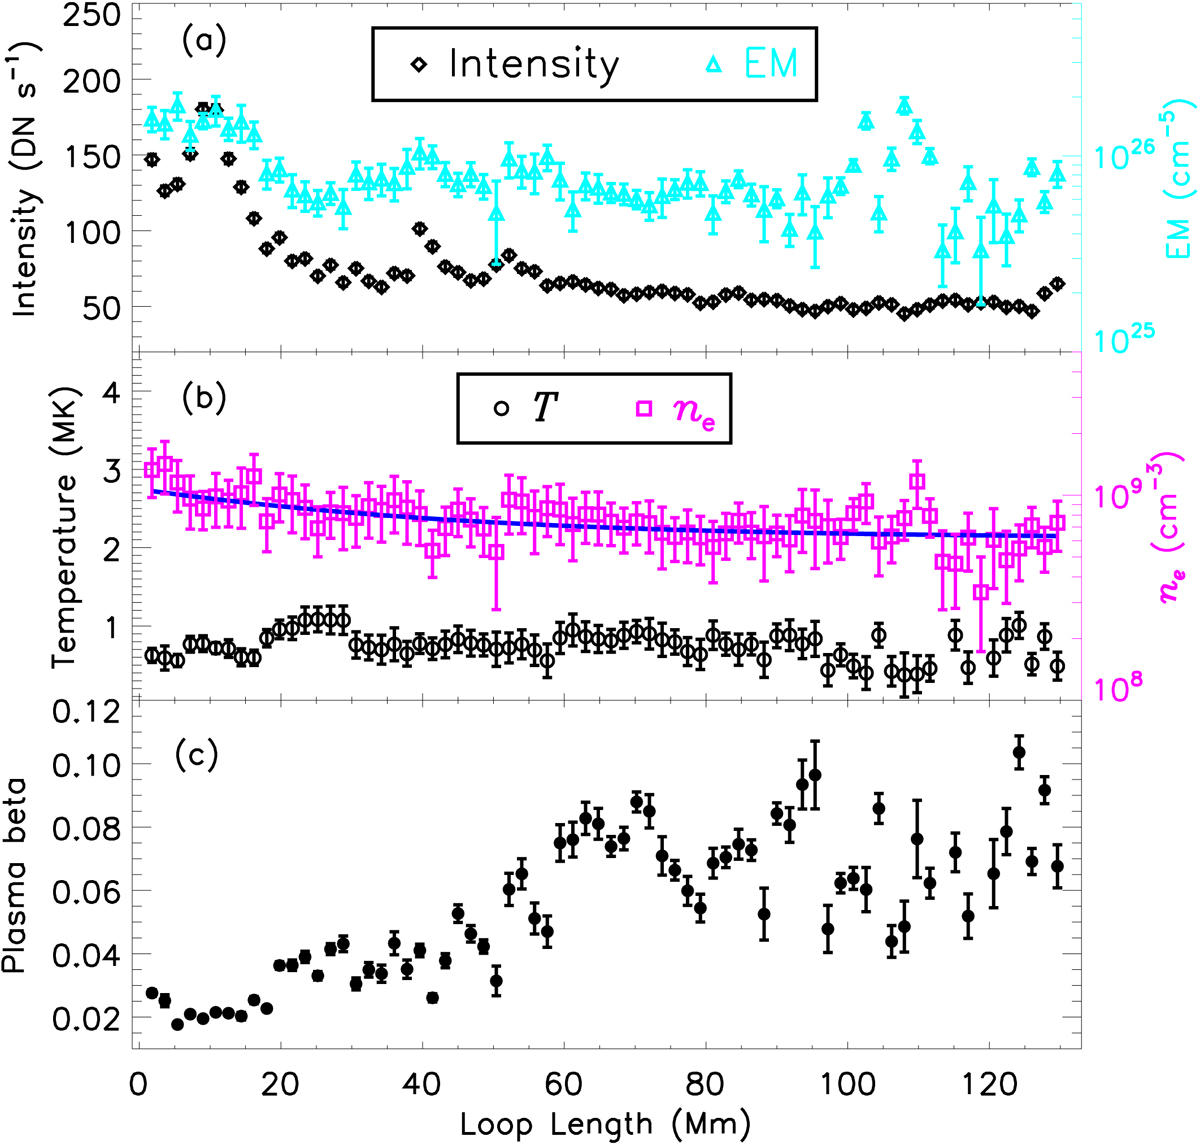
Quantitative estimate of the coronal loop parameters. The EM (a), the emission intensity in the AIA 171 Å bandpass (a), the plasma temperature (b), and the number density of electrons (b), as well as the plasma beta (β) as a function of projected length along the loop. The blue line represents the best-fit result for the number density.
Current usage metrics show cumulative count of Article Views (full-text article views including HTML views, PDF and ePub downloads, according to the available data) and Abstracts Views on Vision4Press platform.
Data correspond to usage on the plateform after 2015. The current usage metrics is available 48-96 hours after online publication and is updated daily on week days.
Initial download of the metrics may take a while.