Fig. 3.
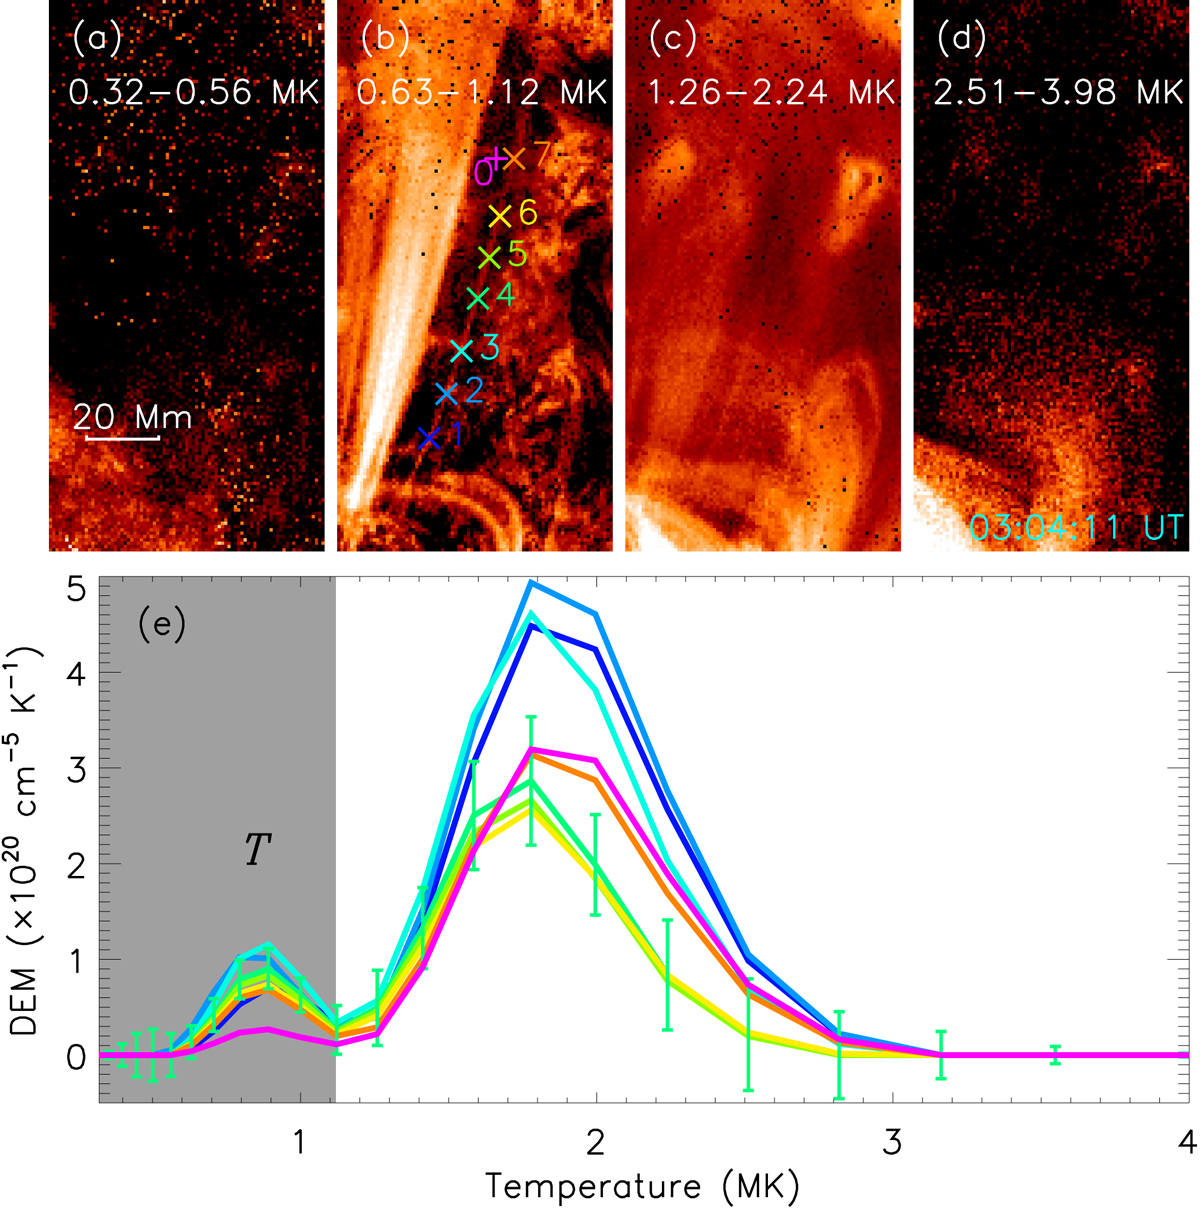
DEM results of the target coronal loop. a–d: narrow-band EM maps integrated in the temperature ranges of 0.32 MK−0.56 MK, 0.63 MK−1.12 MK, 1.26 MK−2.24 MK, and 2.51 MK−3.98 MK. e: DEM profiles at seven selected positions (1−7) along the loop and in one location (0) away from the loop. The color corresponds to the positions labeled in panel b. For clarity, panel e only draws the error bars at loop position 4. The gray region indicates the EM integrated range.
Current usage metrics show cumulative count of Article Views (full-text article views including HTML views, PDF and ePub downloads, according to the available data) and Abstracts Views on Vision4Press platform.
Data correspond to usage on the plateform after 2015. The current usage metrics is available 48-96 hours after online publication and is updated daily on week days.
Initial download of the metrics may take a while.