Fig. 2.
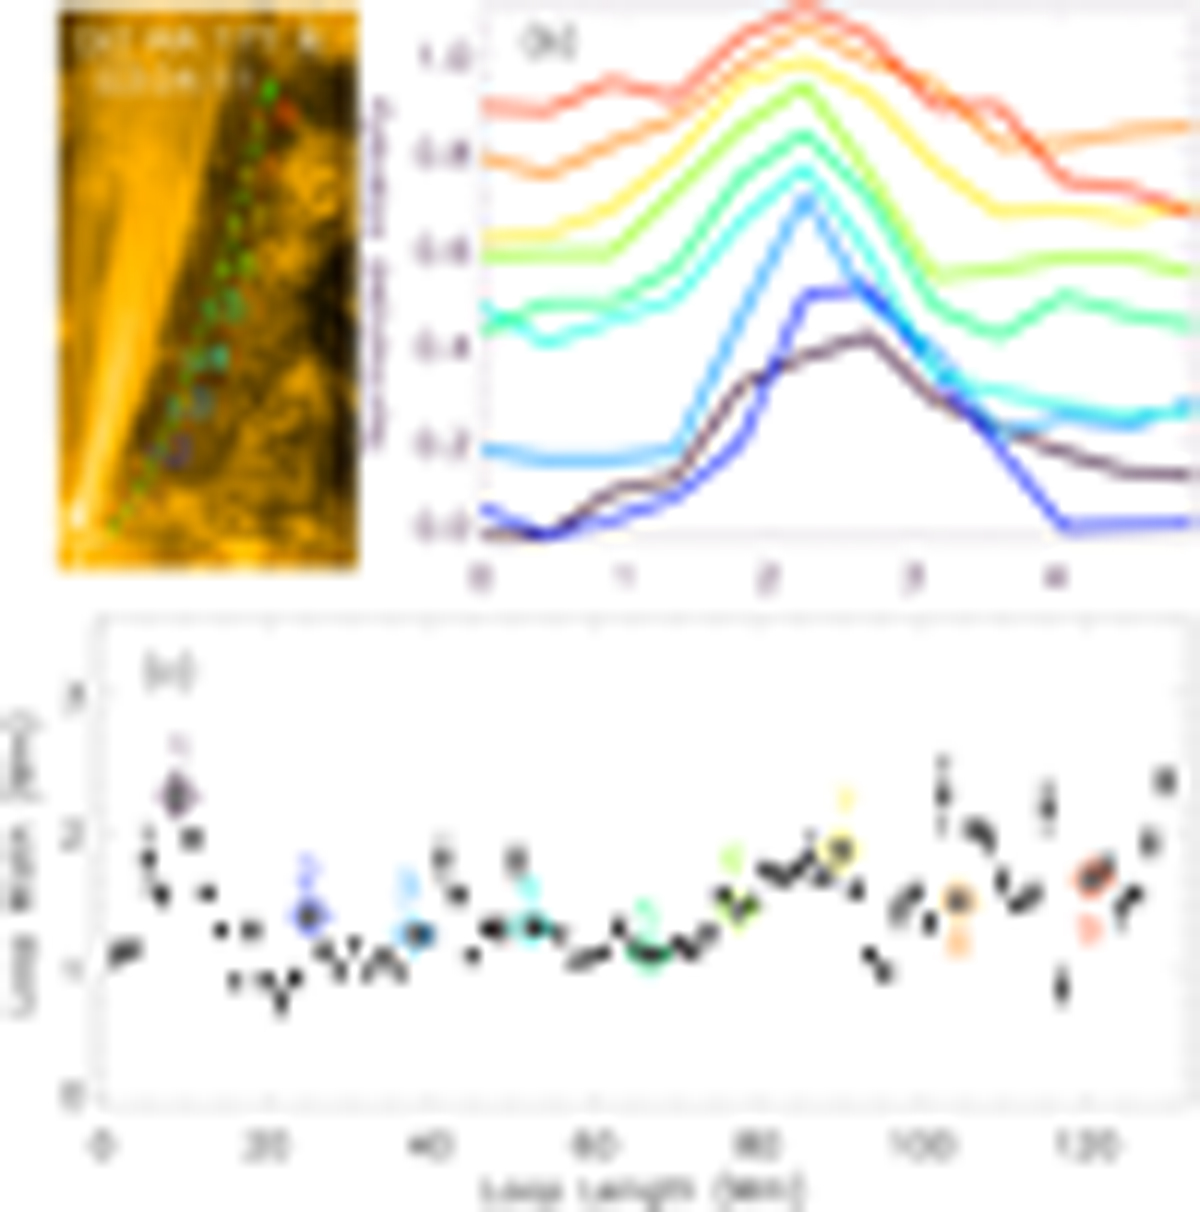
Estimation of the loop width. a) smaller FOV (∼76 Mm × 149 Mm) of the AIA 171 Å image. The loop is highlighted by a green arrow. Nine sample cuts are marked by short lines and are numbered from 1 to 9. b) intensity profiles along the cuts indicated in panel a, normalized by their maximum intensity. The color used in each curve is the same as used in the numbered short lines in panel a. Each profile is elevated progressively for visualization purpose. c) loop width variation along the loop length. The numbers mark the nine loop segments in panel a.
Current usage metrics show cumulative count of Article Views (full-text article views including HTML views, PDF and ePub downloads, according to the available data) and Abstracts Views on Vision4Press platform.
Data correspond to usage on the plateform after 2015. The current usage metrics is available 48-96 hours after online publication and is updated daily on week days.
Initial download of the metrics may take a while.