Fig. 1.
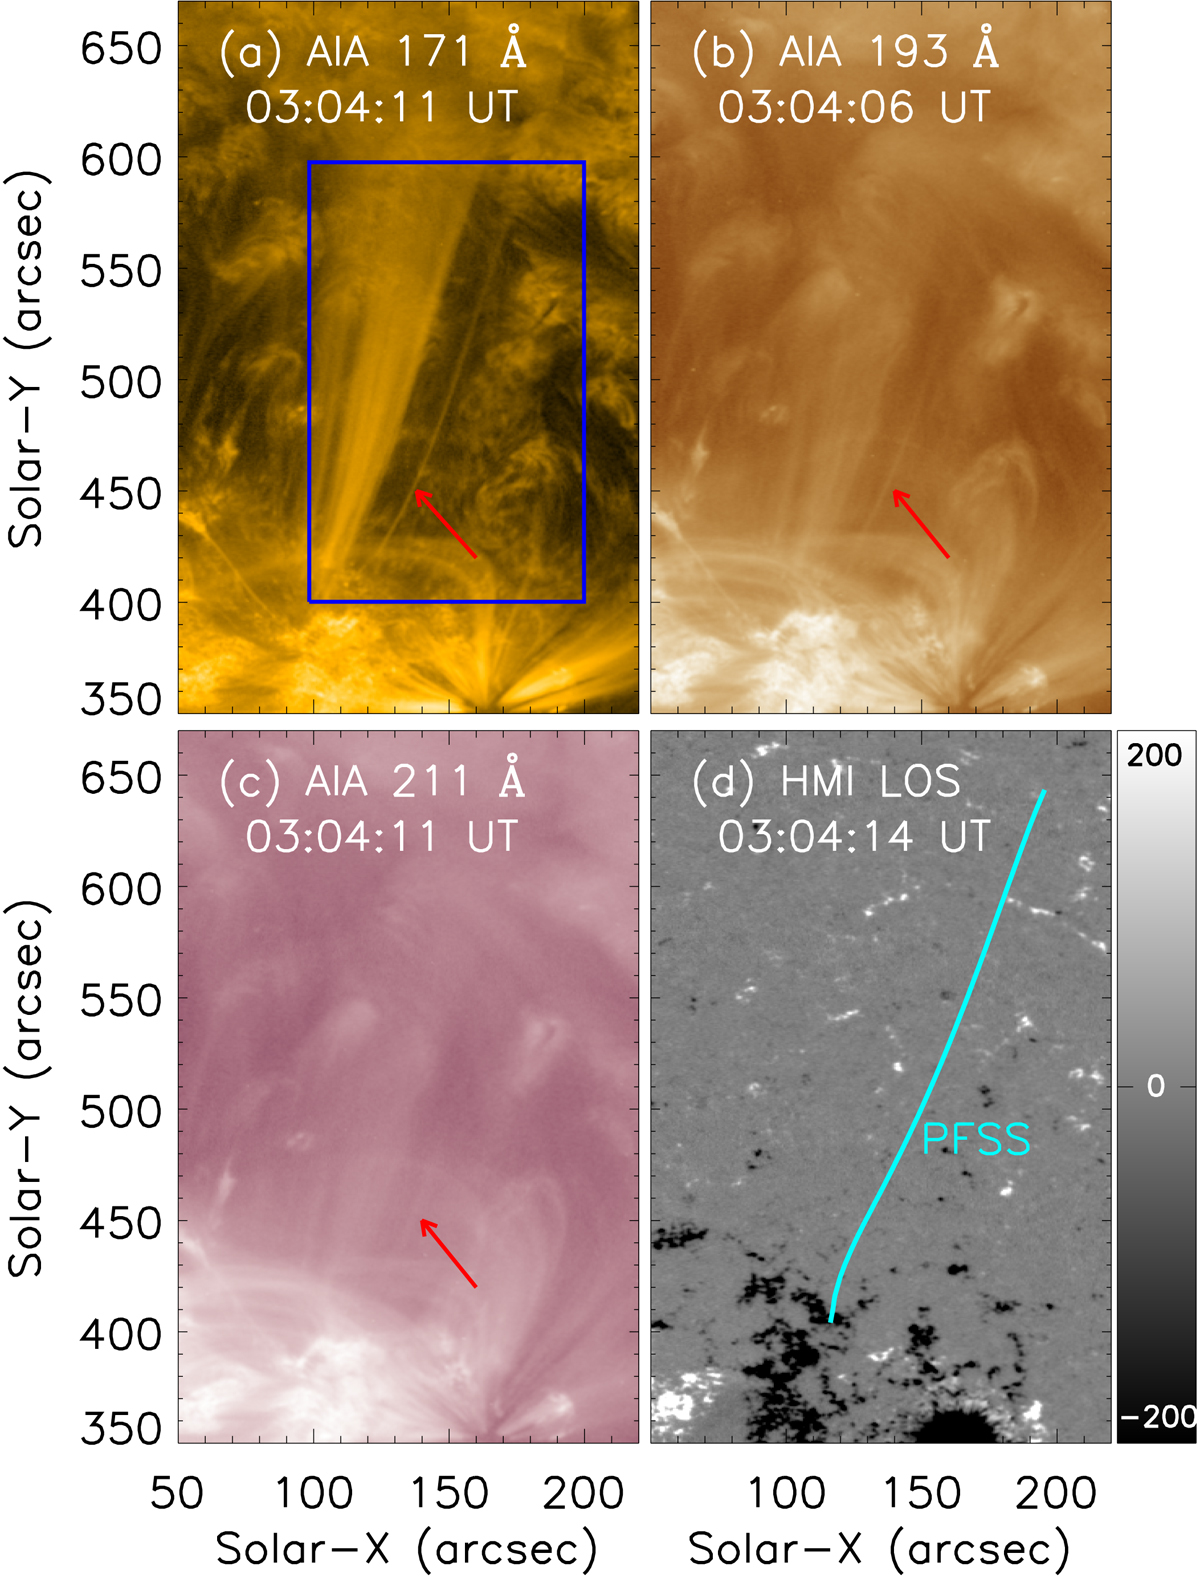
Overview of the coronal loop observed on 2016 March 23. The FOV was observed at about 03:04 UT in AIA 171 Å (a), 193 Å (b), 211 Å (c), and in the HMI LOS magnetic magnetogram (d). The coronal loop of interest is indicated by an arrow in each panel. Within the PFSS magnetic field extrapolation, the magnetic field line that is closely aligned with this loop is overlaid (cyan curve) on the HMI LOS magnetogram. The region of interest used in the DEM analysis is enclosed in the blue rectangle. The evolution of this loop is shown in an online movie.
Current usage metrics show cumulative count of Article Views (full-text article views including HTML views, PDF and ePub downloads, according to the available data) and Abstracts Views on Vision4Press platform.
Data correspond to usage on the plateform after 2015. The current usage metrics is available 48-96 hours after online publication and is updated daily on week days.
Initial download of the metrics may take a while.