Fig. 3.
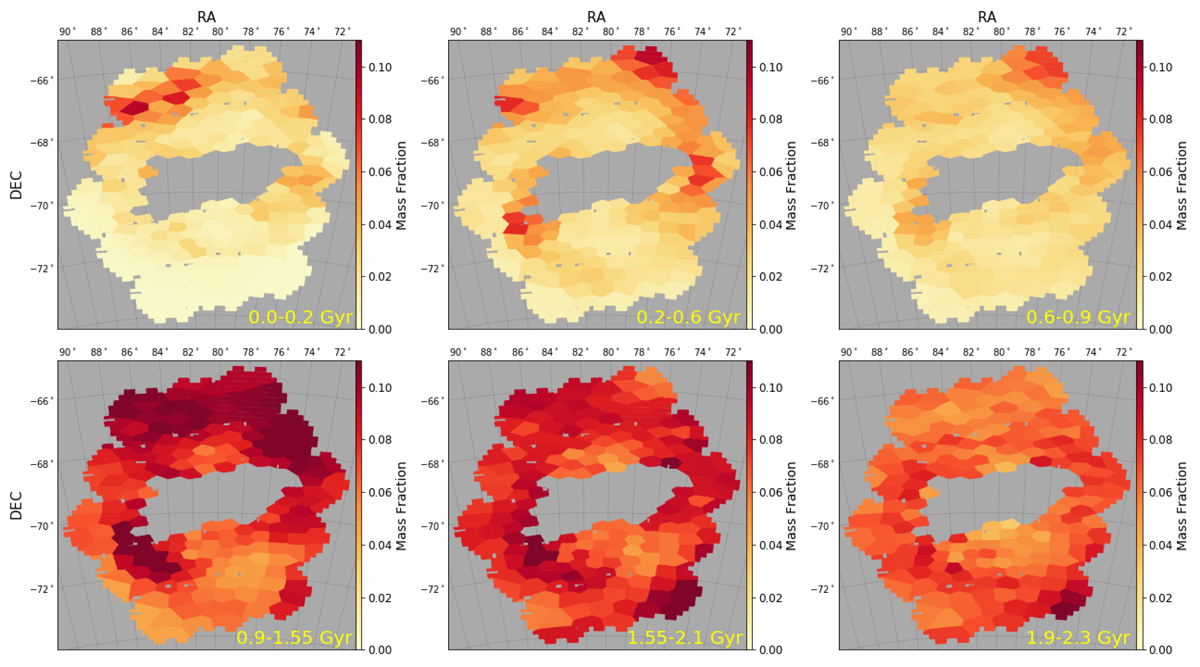
Spatial distribution of the stellar mass fractions of different stellar populations (younger than 2.3 Gyr) in the LMC disc. The stellar populations are defined based on their age (indicated in the lower-right corner of each panel); youngest to oldest from the top-left to the bottom-right panels. The mass fraction is normalised to the mass in each spatial bin, i.e. the sum of the fractions of all populations (including older than 2.3 Gyr) in each spatial bin is 1.
Current usage metrics show cumulative count of Article Views (full-text article views including HTML views, PDF and ePub downloads, according to the available data) and Abstracts Views on Vision4Press platform.
Data correspond to usage on the plateform after 2015. The current usage metrics is available 48-96 hours after online publication and is updated daily on week days.
Initial download of the metrics may take a while.