Fig. C.2.
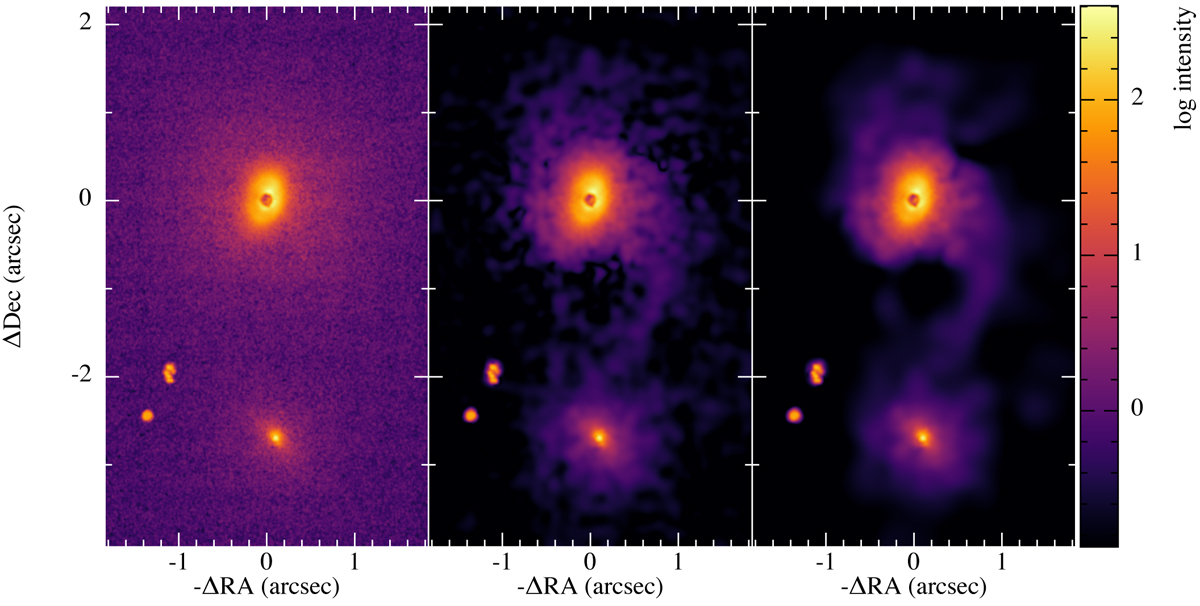
J-band polarized intensity images. Left panel: native J-band image shown in log stretch. Middle panel: de-noised J-band polarized intensity image where the Stokes Q and U images were combined before applying the de-noising procedure. Right panel: de-noised J-band image where the Q and U images were de-noised separately before combining to produce the polarized intensity de-noised image.
Current usage metrics show cumulative count of Article Views (full-text article views including HTML views, PDF and ePub downloads, according to the available data) and Abstracts Views on Vision4Press platform.
Data correspond to usage on the plateform after 2015. The current usage metrics is available 48-96 hours after online publication and is updated daily on week days.
Initial download of the metrics may take a while.