Open Access
Fig. C.1.
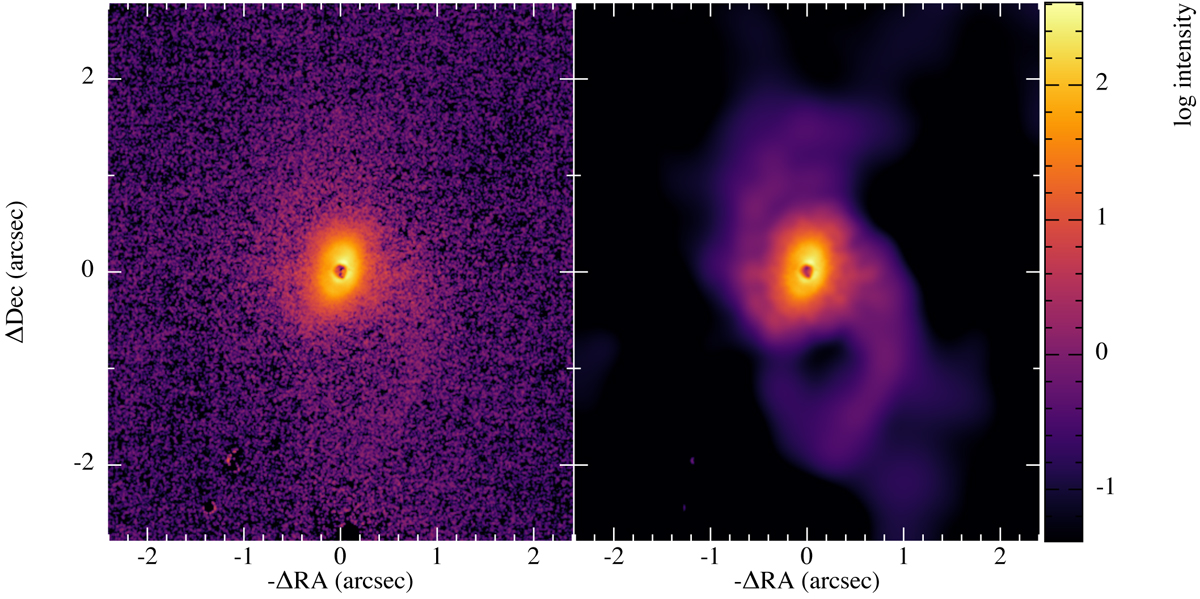
J-band polarized intensity images. Left panel: native J-band image shown in log stretch. The two spirals a barely detectable above background noise. Right panel: denoised J-band image. At the expense of a slight loss of angular resolution, the de-noised spirals are easily detectable.
Current usage metrics show cumulative count of Article Views (full-text article views including HTML views, PDF and ePub downloads, according to the available data) and Abstracts Views on Vision4Press platform.
Data correspond to usage on the plateform after 2015. The current usage metrics is available 48-96 hours after online publication and is updated daily on week days.
Initial download of the metrics may take a while.