Fig. B.2.
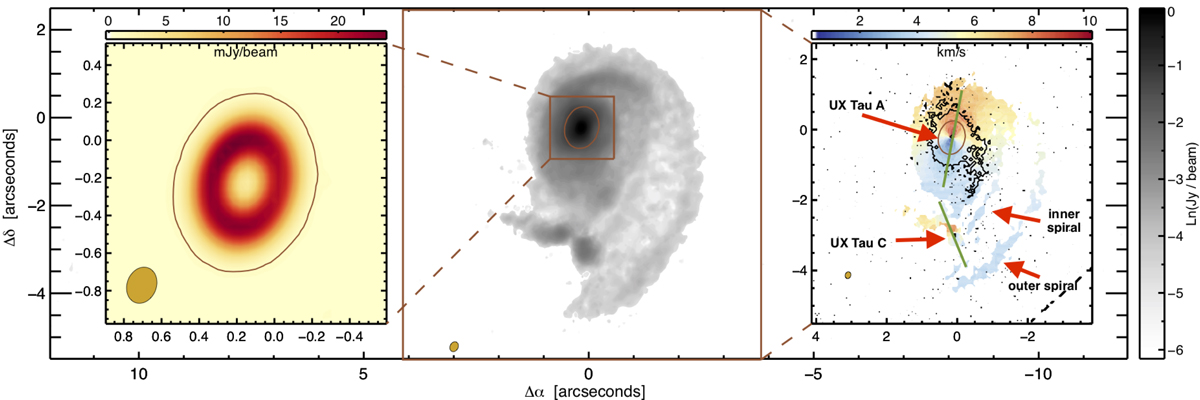
CO J = 3 − 2 integrated intensity map (moment 0, in grayscale at the center) of the region spanning UX Tau A and C, located at offset [0,0] and [0,−2.7], respectively. Left insert: zoom of the ringed-disk seen in 0.84 mm continuum emission. Right insert: map of the peak intensity velocity, where the rotation signature of the disk of both UX Tau A and C are clearly seen. Labels indicating the various features are added. The two green lines indicate the direction of the velocity gradients in the disks. The deep J-band scattered light map of Fig. 2 is shown in black contours. In each panel the brown contour ellipse around UX Tau A is drawn at 10 times the continuum RMS of 58 μJy. The beam is shown in the bottom left of each panel.
Current usage metrics show cumulative count of Article Views (full-text article views including HTML views, PDF and ePub downloads, according to the available data) and Abstracts Views on Vision4Press platform.
Data correspond to usage on the plateform after 2015. The current usage metrics is available 48-96 hours after online publication and is updated daily on week days.
Initial download of the metrics may take a while.