Open Access
Fig. B.1.
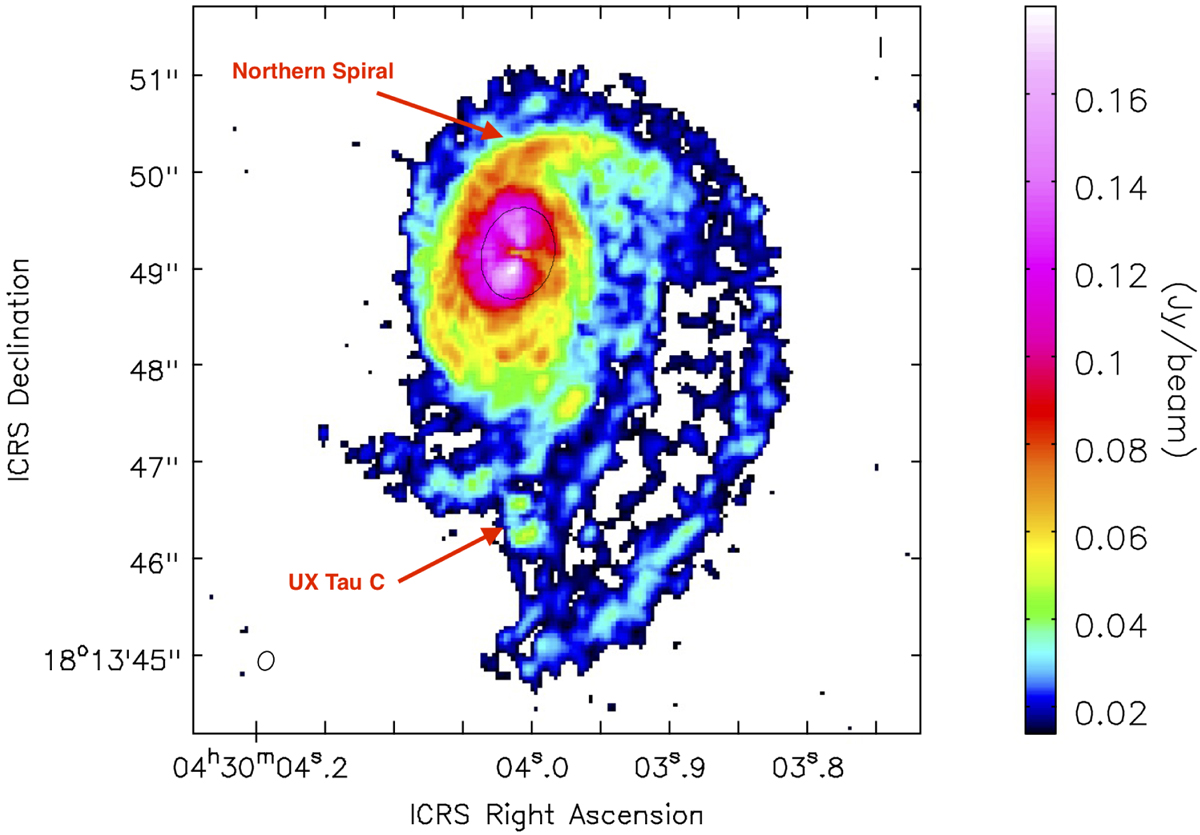
Peak intensity map (moment 8) made from the Briggs-weighted CO(3-2) data. The black contour is the continuum emission traced at the 1σ level (58 μJy). The position of UX Tau C is labeled. The northern spiral arm seen in scattered light in Fig. 2 is also indicated.
Current usage metrics show cumulative count of Article Views (full-text article views including HTML views, PDF and ePub downloads, according to the available data) and Abstracts Views on Vision4Press platform.
Data correspond to usage on the plateform after 2015. The current usage metrics is available 48-96 hours after online publication and is updated daily on week days.
Initial download of the metrics may take a while.