Fig. 1.
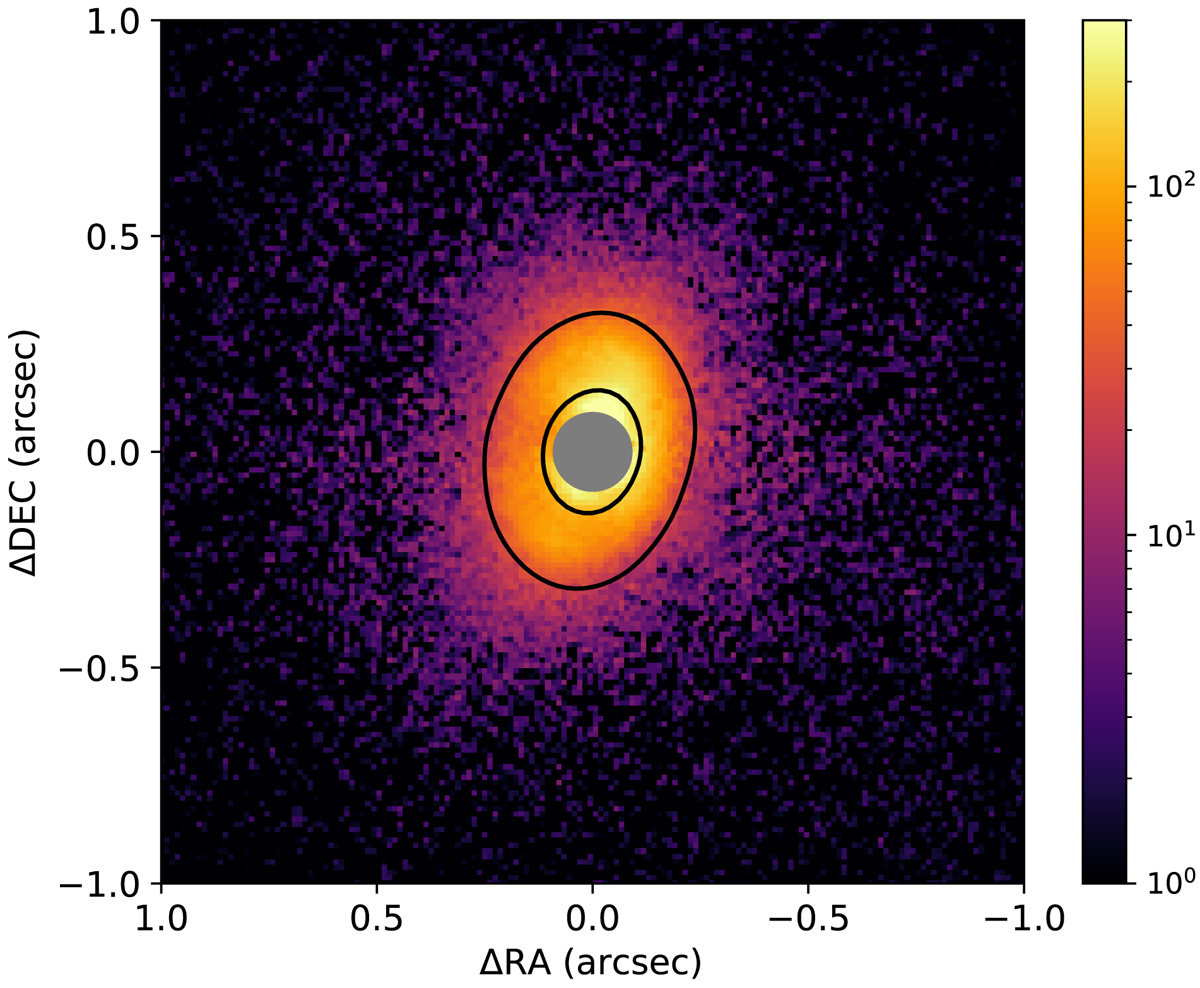
Qϕ, J-band (linearly) polarized intensity image of the disk of UX Tau A, shown in logarithmic scale. The intensity scale is in arbitrary detector units, levels below 1 (i.e., ∼2.5 times the rms noise level at ≥1″) are set to black. The gray circle traces the 185 mas coronagraphic mask. The continuum ring detected by ALMA (see Fig. B.2, left insert) is shown in black contours traced at 60% of the ALMA continuum peak level.
Current usage metrics show cumulative count of Article Views (full-text article views including HTML views, PDF and ePub downloads, according to the available data) and Abstracts Views on Vision4Press platform.
Data correspond to usage on the plateform after 2015. The current usage metrics is available 48-96 hours after online publication and is updated daily on week days.
Initial download of the metrics may take a while.