Fig. 3.
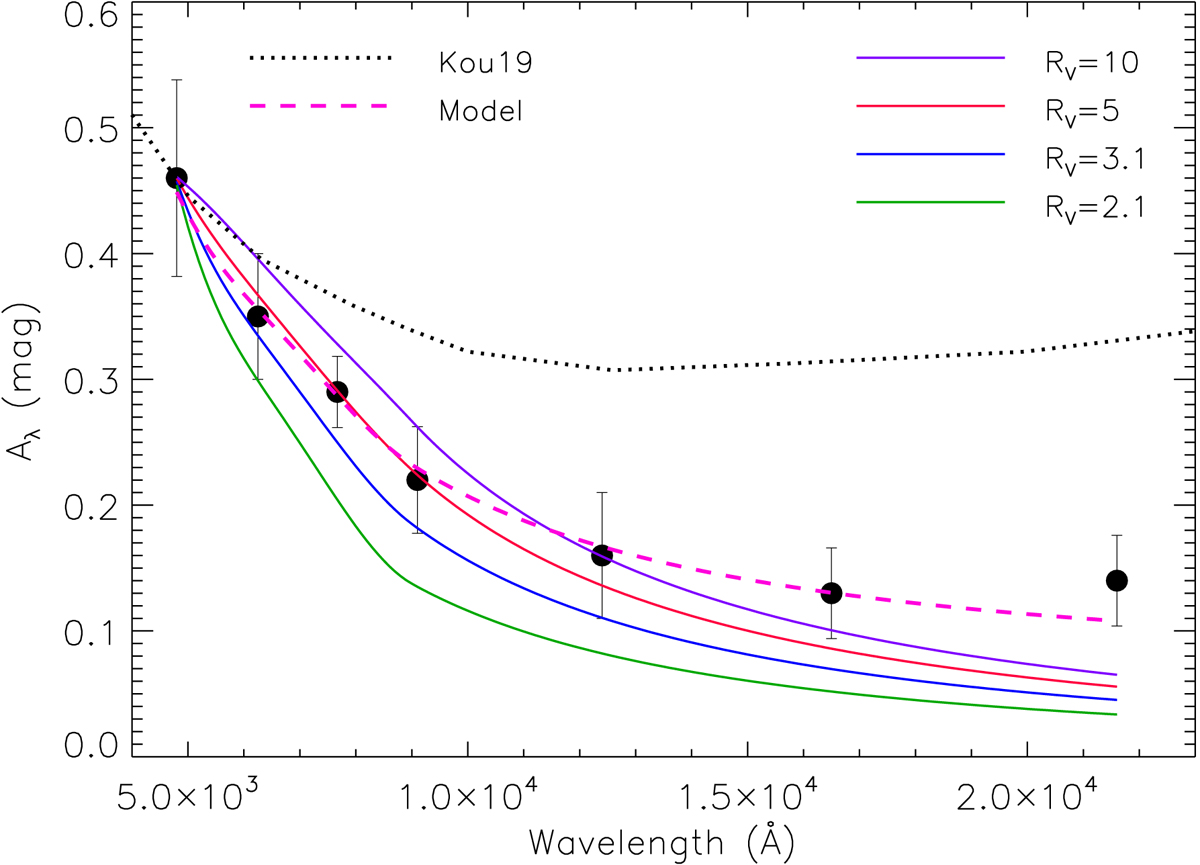
Extinction taken as the amplitude of the second dip (observed at JD = 2458585) as a function of the filter wavelength (dots). The full lines represent extinction laws at different values of RV = AV/E(B − V) according to Cardelli et al. (1989). The dotted black line is the model by Koutoulaki et al. (2019). The dashed line represents our two-component model (Eq. (1)). All curves are normalized to the observed extinction in the g′ band (λc = 4800 Å).
Current usage metrics show cumulative count of Article Views (full-text article views including HTML views, PDF and ePub downloads, according to the available data) and Abstracts Views on Vision4Press platform.
Data correspond to usage on the plateform after 2015. The current usage metrics is available 48-96 hours after online publication and is updated daily on week days.
Initial download of the metrics may take a while.