Fig. 1.
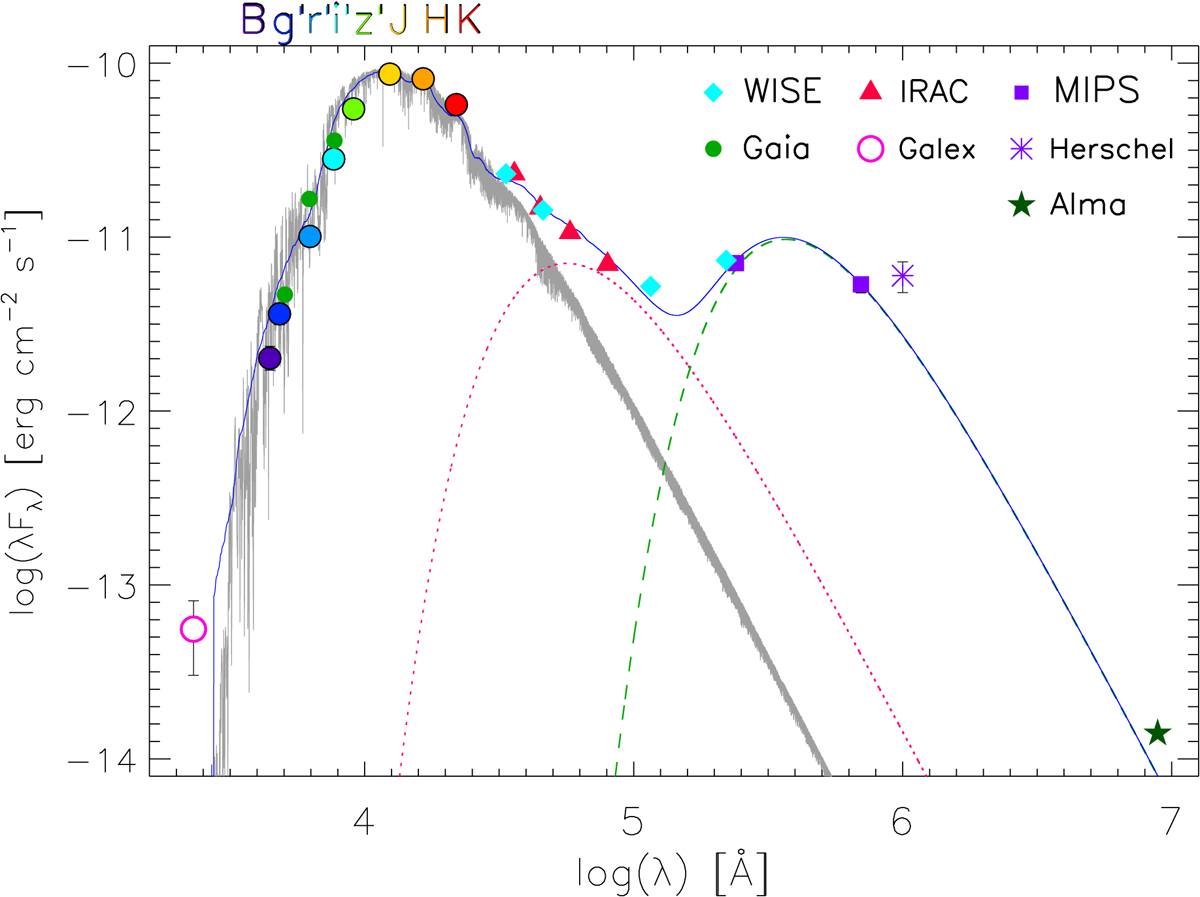
Spectral energy distribution of ISO-ChaI 52. Mid- and far-infrared fluxes are shown with different symbols, as indicated in the legend. The BT-Settl spectrum (Allard et al. 2012) that provides the best fit to the star photosphere is shown by a gray line. The two black bodies with T = 650 K and T = 100 K that fit the MIR and FIR disk emission are shown by the dotted red and dashed green lines, respectively. The continuous blue line displays the sum of the smoothed photospheric template and the two black bodies.
Current usage metrics show cumulative count of Article Views (full-text article views including HTML views, PDF and ePub downloads, according to the available data) and Abstracts Views on Vision4Press platform.
Data correspond to usage on the plateform after 2015. The current usage metrics is available 48-96 hours after online publication and is updated daily on week days.
Initial download of the metrics may take a while.