Fig. 9.

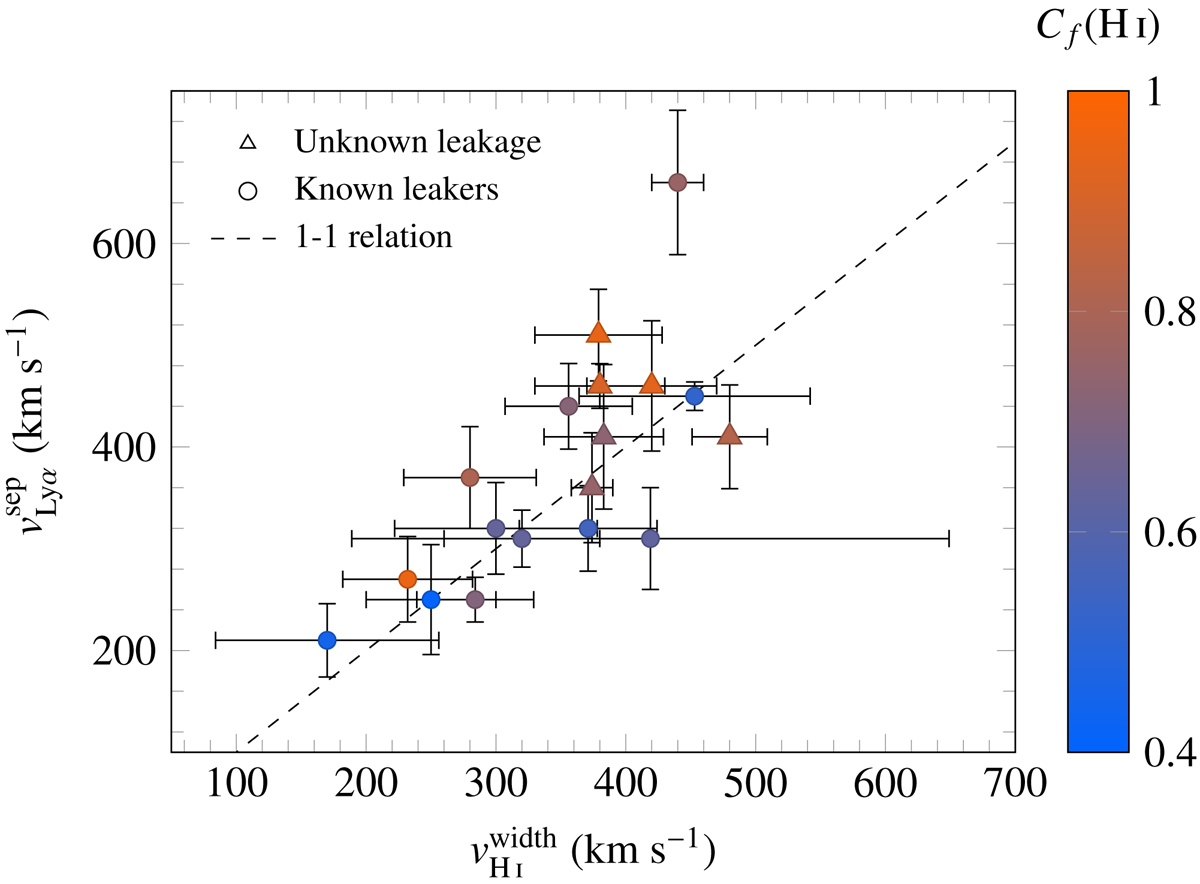
Left: Lyα emission line and Lyβ absorption line in J0921+4509 (Cf(H I) = 0.761). Right: Lyα emission line and Lyβ absorption line in J1442−0209 (Cf(H I) = 0.556). The Lyα spectra have been smoothed to half the resolution of the observations and scaled down with a power law for display purposes. The presence of Lyα emission on top of the optically thick H I absorption line suggests that Lyα photons can escape at lower velocities through low-density channels. Similar plots for all the galaxies in our sample are given in Appendix C.
Current usage metrics show cumulative count of Article Views (full-text article views including HTML views, PDF and ePub downloads, according to the available data) and Abstracts Views on Vision4Press platform.
Data correspond to usage on the plateform after 2015. The current usage metrics is available 48-96 hours after online publication and is updated daily on week days.
Initial download of the metrics may take a while.


