Fig. 6.
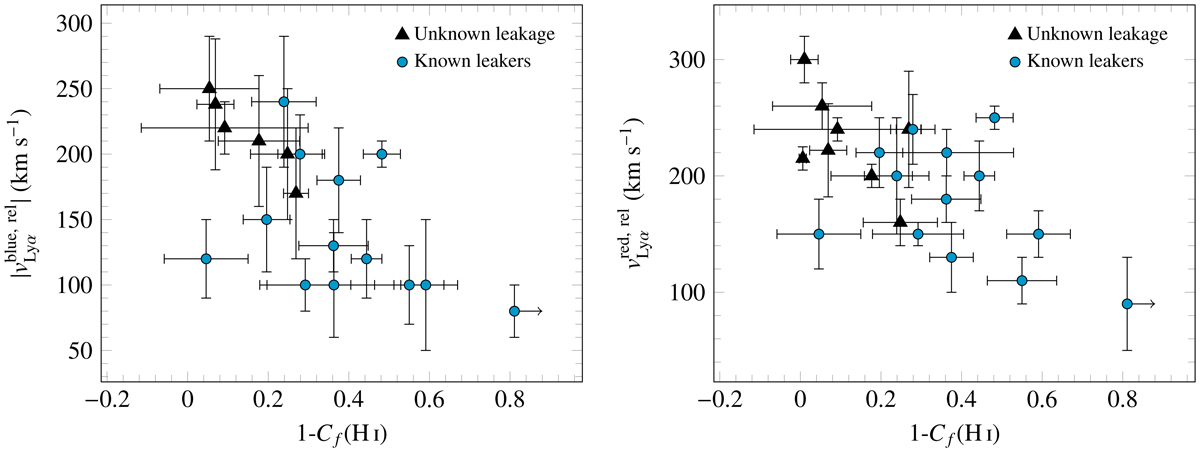
Relation between the Lyα peak velocity separation (![]() ) versus 1-Cf(H I). Our sample is represented by black triangles and blue circles for galaxies with unknown and known leakage, respectively. The sample from McKinney et al. (2019) and Jaskot et al. (2019) is shown with orange squares. We note that the latter studies only report Cf(Si II) measurements, from which we derived the corresponding Cf(H I) using the empirical Cf(Si II)-Cf(H I) relation found in Gazagnes et al. (2018).
) versus 1-Cf(H I). Our sample is represented by black triangles and blue circles for galaxies with unknown and known leakage, respectively. The sample from McKinney et al. (2019) and Jaskot et al. (2019) is shown with orange squares. We note that the latter studies only report Cf(Si II) measurements, from which we derived the corresponding Cf(H I) using the empirical Cf(Si II)-Cf(H I) relation found in Gazagnes et al. (2018).
Current usage metrics show cumulative count of Article Views (full-text article views including HTML views, PDF and ePub downloads, according to the available data) and Abstracts Views on Vision4Press platform.
Data correspond to usage on the plateform after 2015. The current usage metrics is available 48-96 hours after online publication and is updated daily on week days.
Initial download of the metrics may take a while.