Fig. 3.
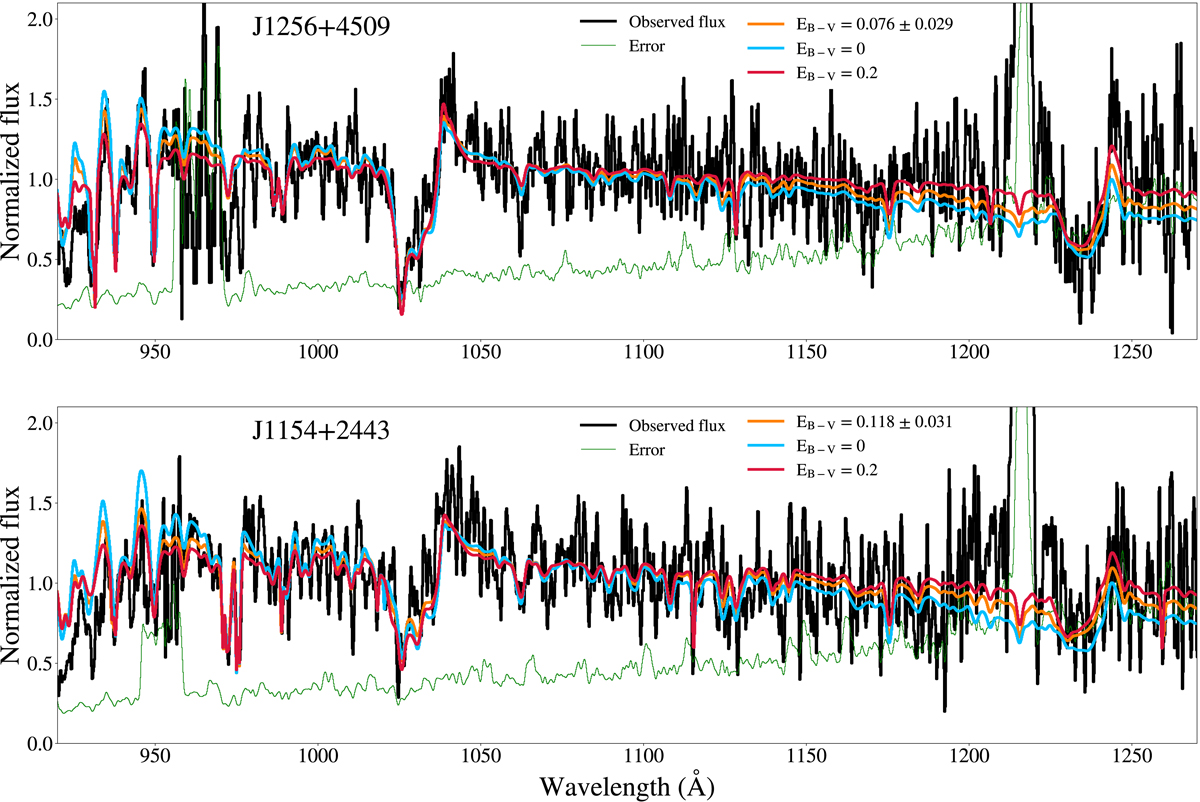
Top: observed flux in the galaxy J1256+4509 (black curve), error (green), fit obtained letting EB − V as a free parameter (orange), fits obtained when fixing EB − V to 0 and 0.2 (blue and red lines) respectively. Bottom: same for the galaxy J1154+2443. Both spectra have been normalized using the median flux between 1090 and 1100 Å. The wavelength regions with Lyα emission (between 1205 to 1225 Å) or low S/N (< 1) are masked during the fitting procedure (see Fig. 1).
Current usage metrics show cumulative count of Article Views (full-text article views including HTML views, PDF and ePub downloads, according to the available data) and Abstracts Views on Vision4Press platform.
Data correspond to usage on the plateform after 2015. The current usage metrics is available 48-96 hours after online publication and is updated daily on week days.
Initial download of the metrics may take a while.