Fig. C.1.
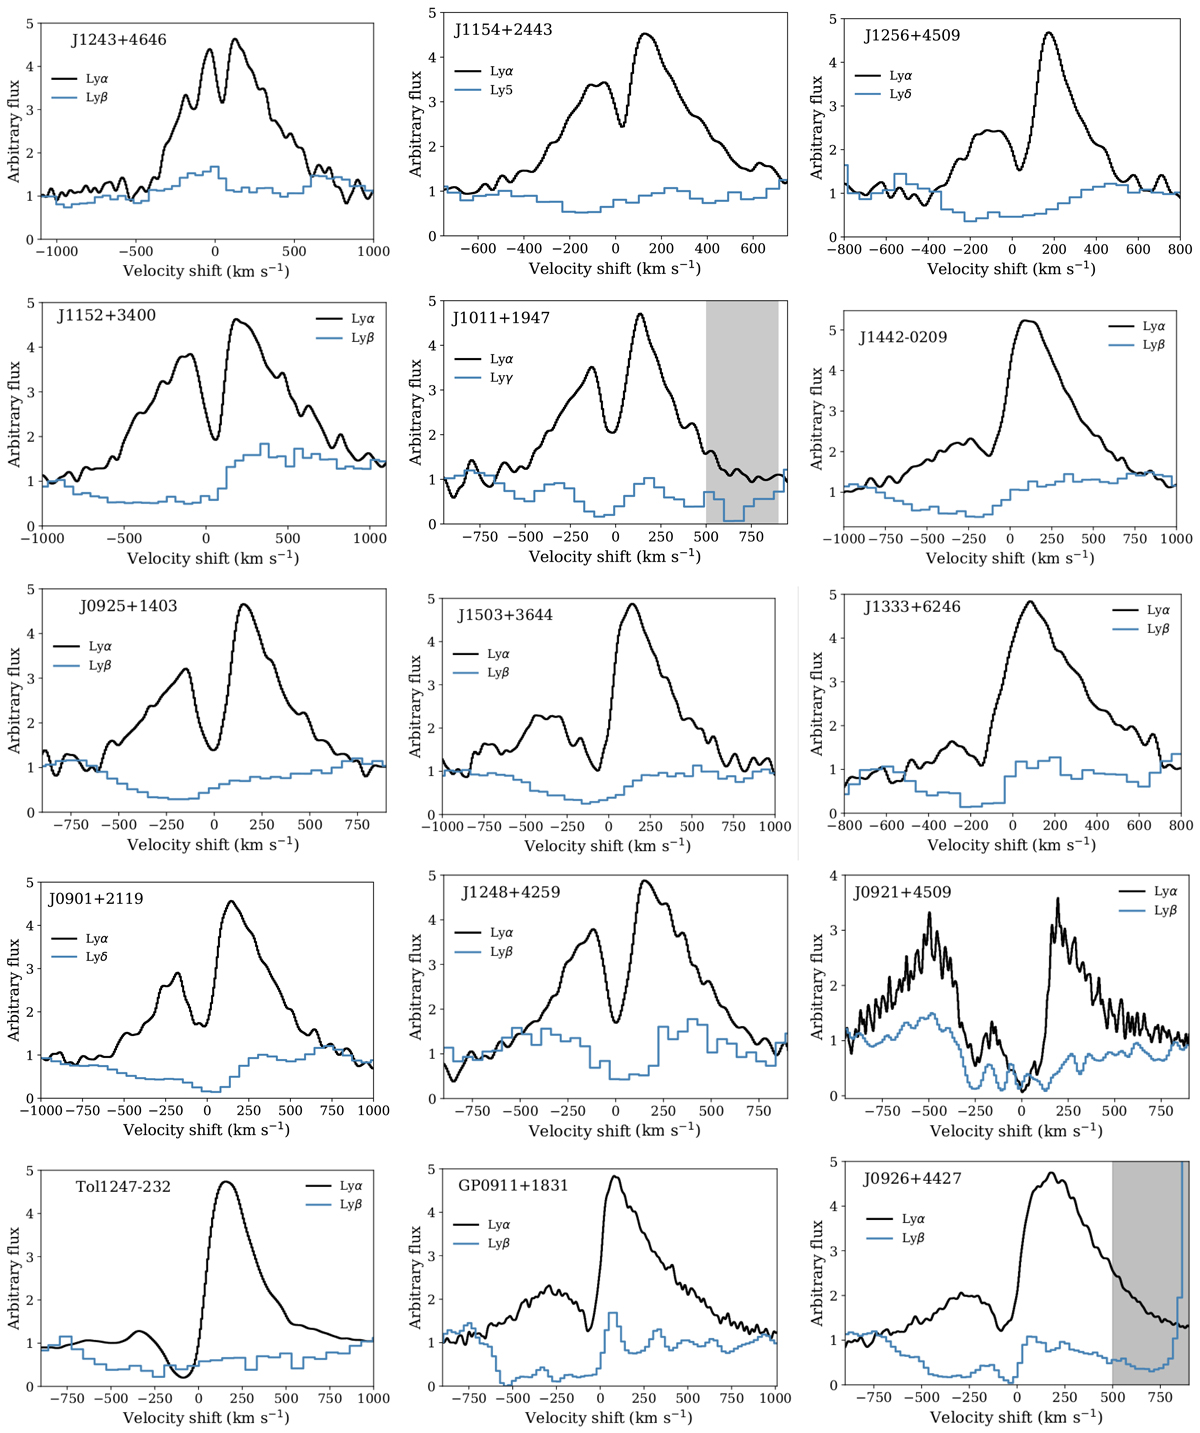
Lyα emission and the observed H I Lyman series line with the larger S/N in the velocity space for 15 of the 22 galaxies in our sample. The Lyα flux has been smoothed to the resolution of the Lyman series and scaled down by an arbitrary power law for display purpose. Gray-shaded regions show contamination from the geocoronal emission or Milky Way absorption lines next to the H I absorption line.
Current usage metrics show cumulative count of Article Views (full-text article views including HTML views, PDF and ePub downloads, according to the available data) and Abstracts Views on Vision4Press platform.
Data correspond to usage on the plateform after 2015. The current usage metrics is available 48-96 hours after online publication and is updated daily on week days.
Initial download of the metrics may take a while.