Free Access
Fig. 2.
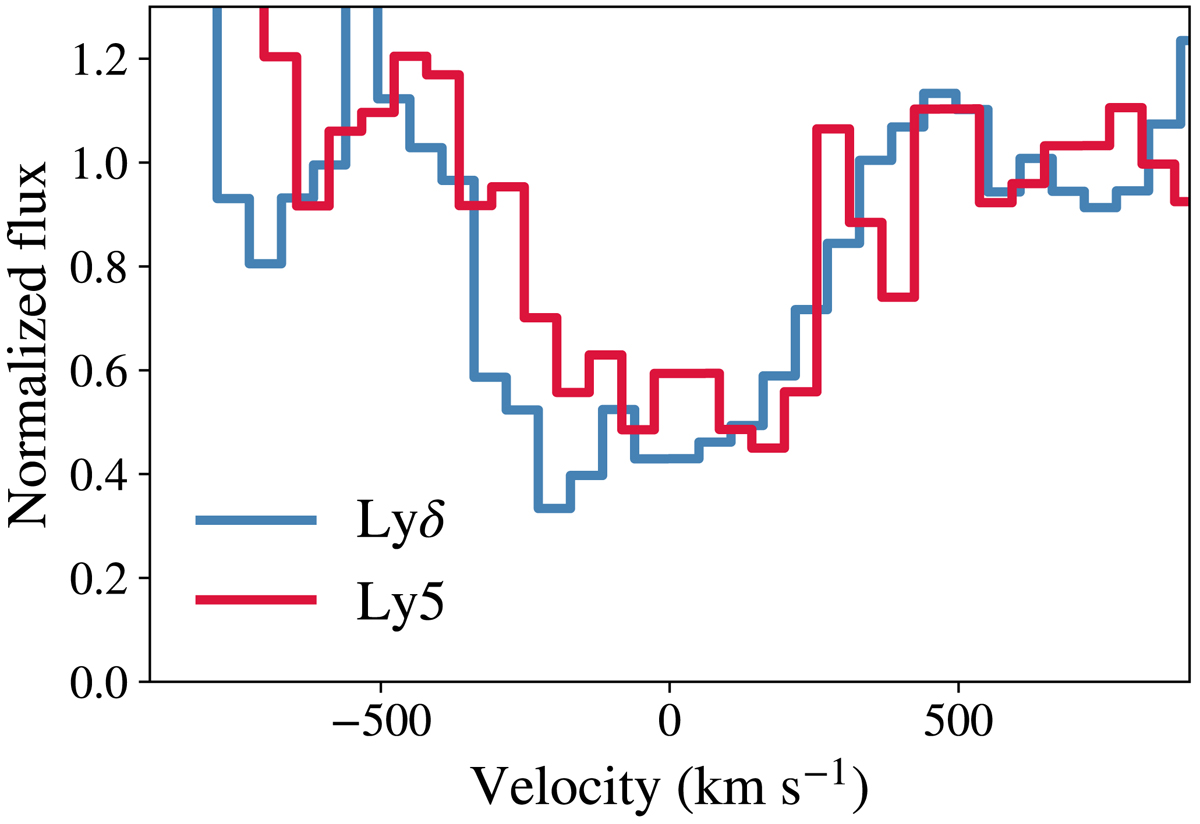
Lyδ (blue) and Ly5 (red) absorption lines in the galaxy J1256+4509. The flux has been normalized using the median of the observed spectra taken between 500 and 1000 km s−1 from the absorption lines. The two H I absorption lines have similar depth and width, which indicates that they are saturated.
Current usage metrics show cumulative count of Article Views (full-text article views including HTML views, PDF and ePub downloads, according to the available data) and Abstracts Views on Vision4Press platform.
Data correspond to usage on the plateform after 2015. The current usage metrics is available 48-96 hours after online publication and is updated daily on week days.
Initial download of the metrics may take a while.