Fig. 13.
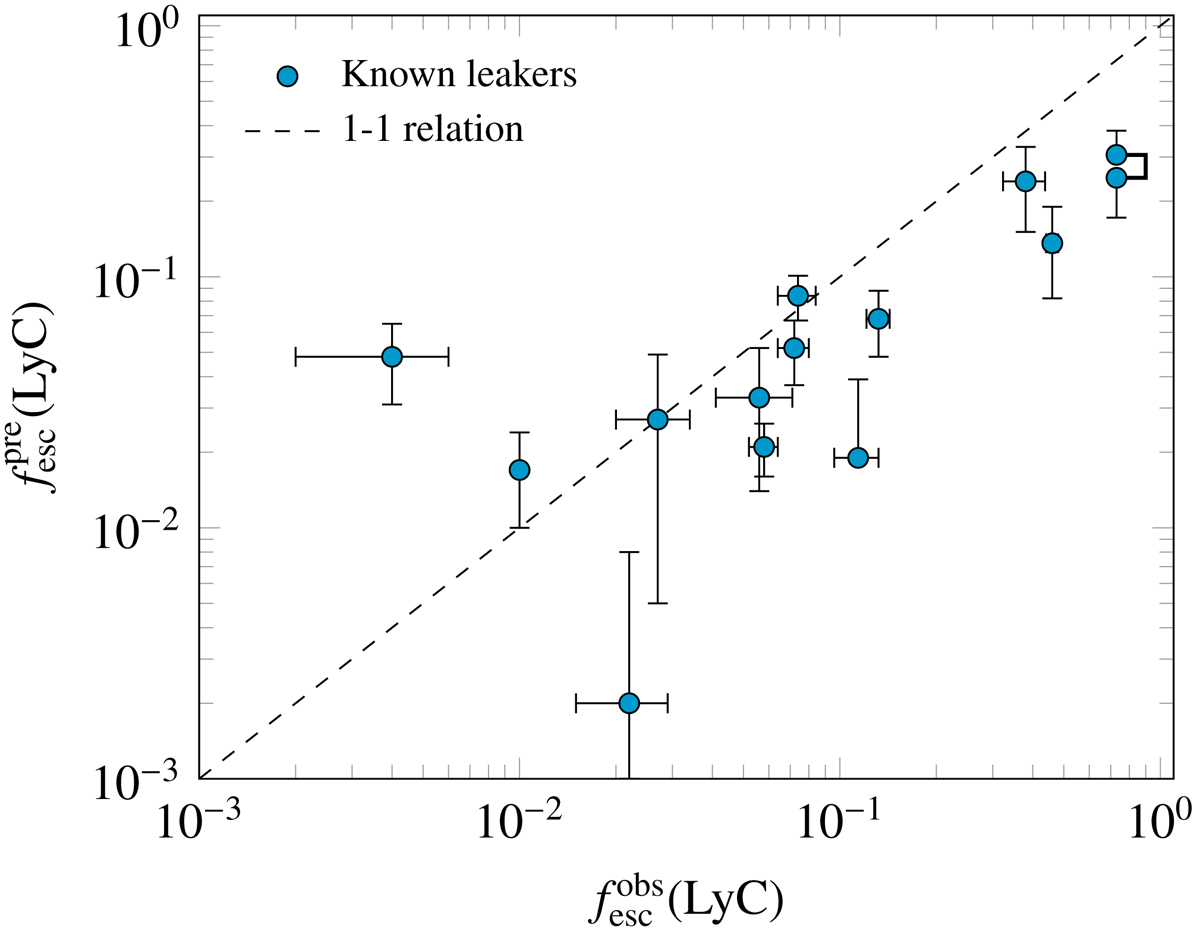
Predicted LyC escape fraction ![]() , using the H I covering fraction and dust extinction, versus the observed fesc(LyC) plotted on a logarithmic scale. Dashed lines show the one-to-one relation. Two different predictions have been derived for J1243+4646 using Cf(H I) = 0.18 (upper limit), and Cf(H I) = 0, and are shown on the upper right part of the figure. The error bars on
, using the H I covering fraction and dust extinction, versus the observed fesc(LyC) plotted on a logarithmic scale. Dashed lines show the one-to-one relation. Two different predictions have been derived for J1243+4646 using Cf(H I) = 0.18 (upper limit), and Cf(H I) = 0, and are shown on the upper right part of the figure. The error bars on ![]() are obtained by propagating the uncertainties from Cf(H I) and EB − V. This figure extends the work done in Fig. 1 of Chisholm et al. (2018) by including the 6 new LyC detections from Izotov et al. (2018a,b).
are obtained by propagating the uncertainties from Cf(H I) and EB − V. This figure extends the work done in Fig. 1 of Chisholm et al. (2018) by including the 6 new LyC detections from Izotov et al. (2018a,b).
Current usage metrics show cumulative count of Article Views (full-text article views including HTML views, PDF and ePub downloads, according to the available data) and Abstracts Views on Vision4Press platform.
Data correspond to usage on the plateform after 2015. The current usage metrics is available 48-96 hours after online publication and is updated daily on week days.
Initial download of the metrics may take a while.