Fig. 10.
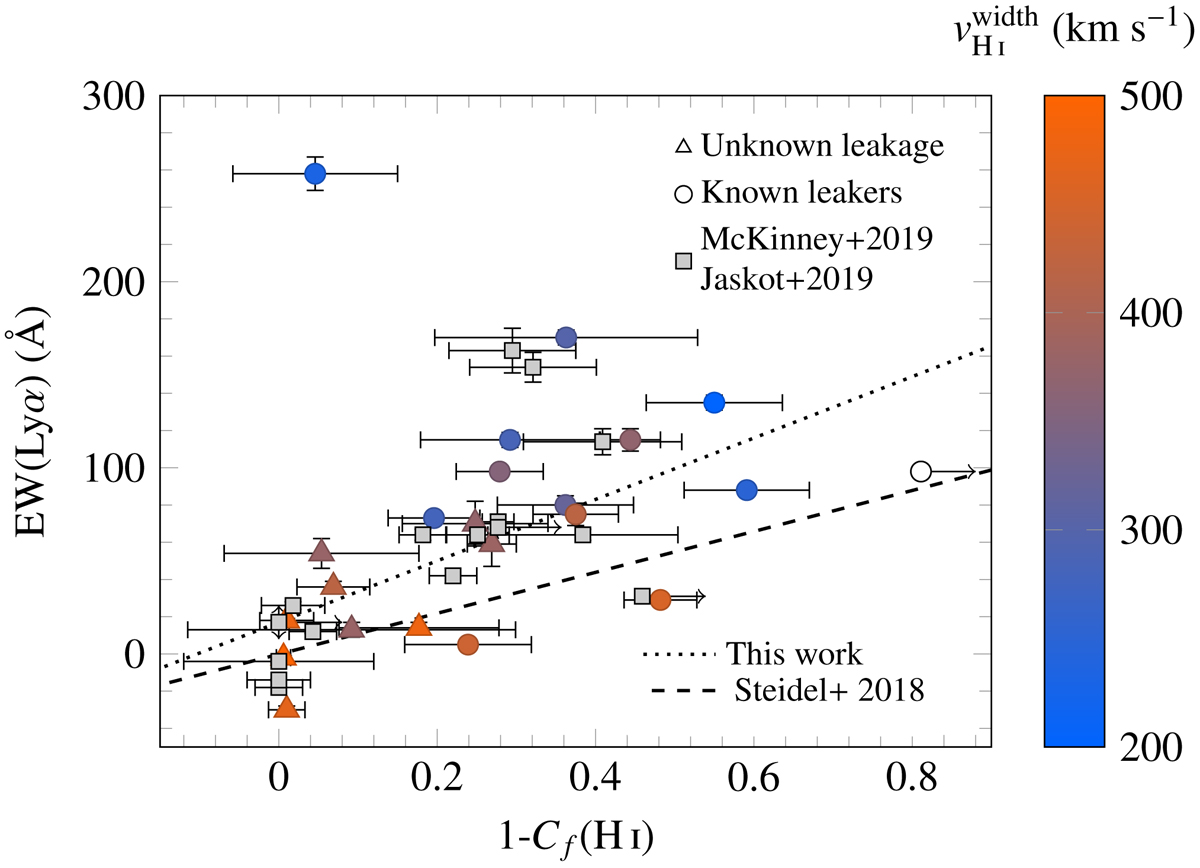
Lyα equivalent width versus the porosity of the neutral gas as given by 1–Cf(H I). The color bar represents the H I velocity interval where the Lyman series is at its maximum depth. Our sample is represented by triangles and circles for galaxies with unknown and known leakage respectively, and the sample from McKinney et al. (2019) and Jaskot et al. (2019) is shown with gray squares as they do not have H I velocity width measurements. The dashed line shows the empirical relation found in Steidel et al. (2018), while the dotted line is the fit to the data, excluding J1248+4259 (see Eq. (5)). This figure suggests that Lyα emission strongly scales with the covering fraction of the channels and with the width of the saturated H I absorption lines.
Current usage metrics show cumulative count of Article Views (full-text article views including HTML views, PDF and ePub downloads, according to the available data) and Abstracts Views on Vision4Press platform.
Data correspond to usage on the plateform after 2015. The current usage metrics is available 48-96 hours after online publication and is updated daily on week days.
Initial download of the metrics may take a while.