Fig. 1.
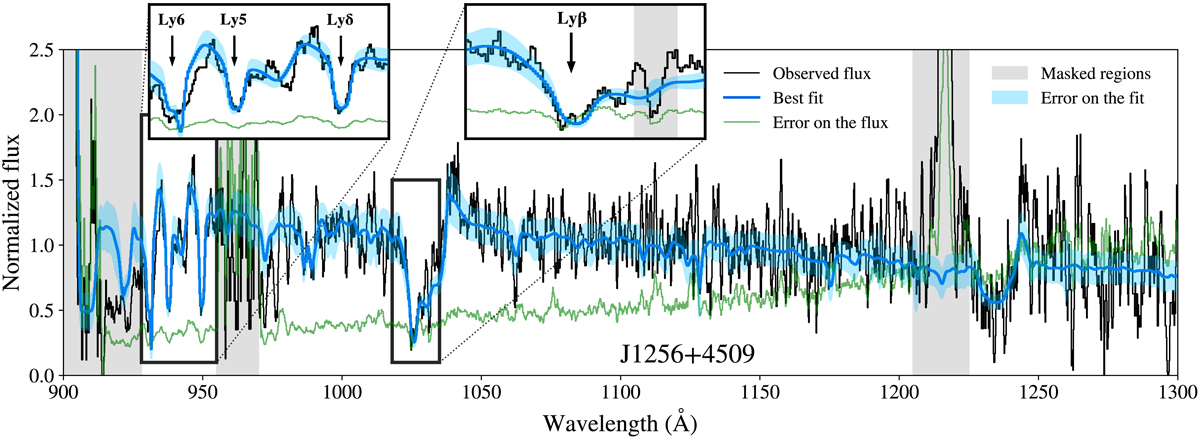
Best fit (blue solid line) obtained for the galaxy J1256+4509. The black and green solid lines show the observed flux and the error on the flux, respectively. Top panels: zooms on the individual Lyman series lines fitted. The gray shaded areas are the principal wavelength regions masked during the fit, due to geo-coronal emission, low S/N or Lyα emission. Additionally, in the top panels, we show the masks for ISM/Milky Way absorption lines that are not included during the fitting procedure. For display purposes, these masks do not appear in the main panel. The blue-shaded area represents the uncertainty on the fit, derived using a Monte-Carlo approach (see details in Sect. 3.1).
Current usage metrics show cumulative count of Article Views (full-text article views including HTML views, PDF and ePub downloads, according to the available data) and Abstracts Views on Vision4Press platform.
Data correspond to usage on the plateform after 2015. The current usage metrics is available 48-96 hours after online publication and is updated daily on week days.
Initial download of the metrics may take a while.