Fig. 3.
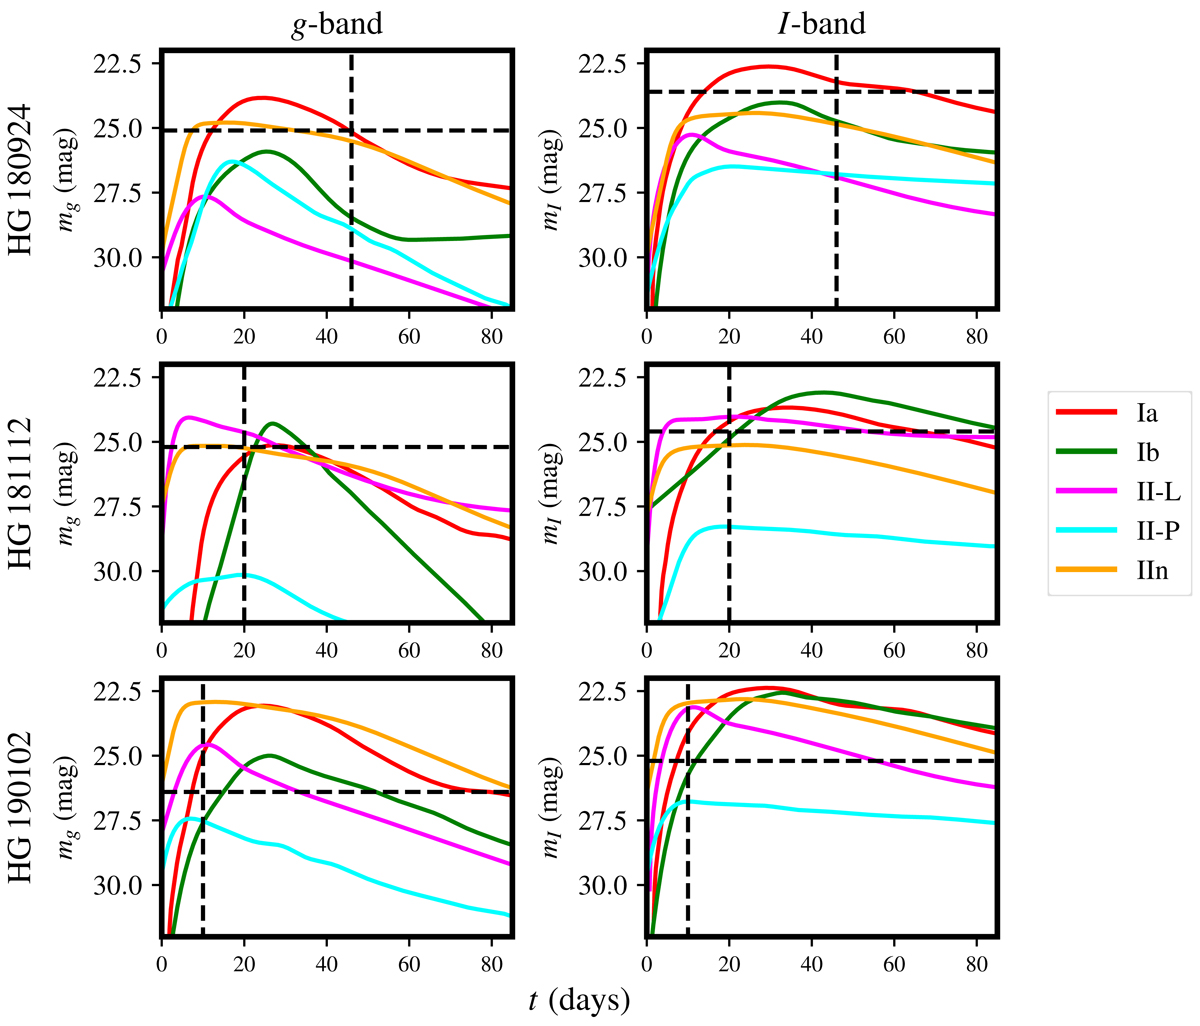
Selection of randomised, observer-frame supernova light curve models (apparent magnitude) from the Monte Carlo analysis sample. Both Milky Way reddening along the line-of-sight and randomised host-galaxy reddening were included in the generation of these curves. The vertical dashed lines indicate the epoch of the first VLT observation of each source, and the horizontal dashed line is the detection limit reported in Table 2.
Current usage metrics show cumulative count of Article Views (full-text article views including HTML views, PDF and ePub downloads, according to the available data) and Abstracts Views on Vision4Press platform.
Data correspond to usage on the plateform after 2015. The current usage metrics is available 48-96 hours after online publication and is updated daily on week days.
Initial download of the metrics may take a while.