Fig. 2.
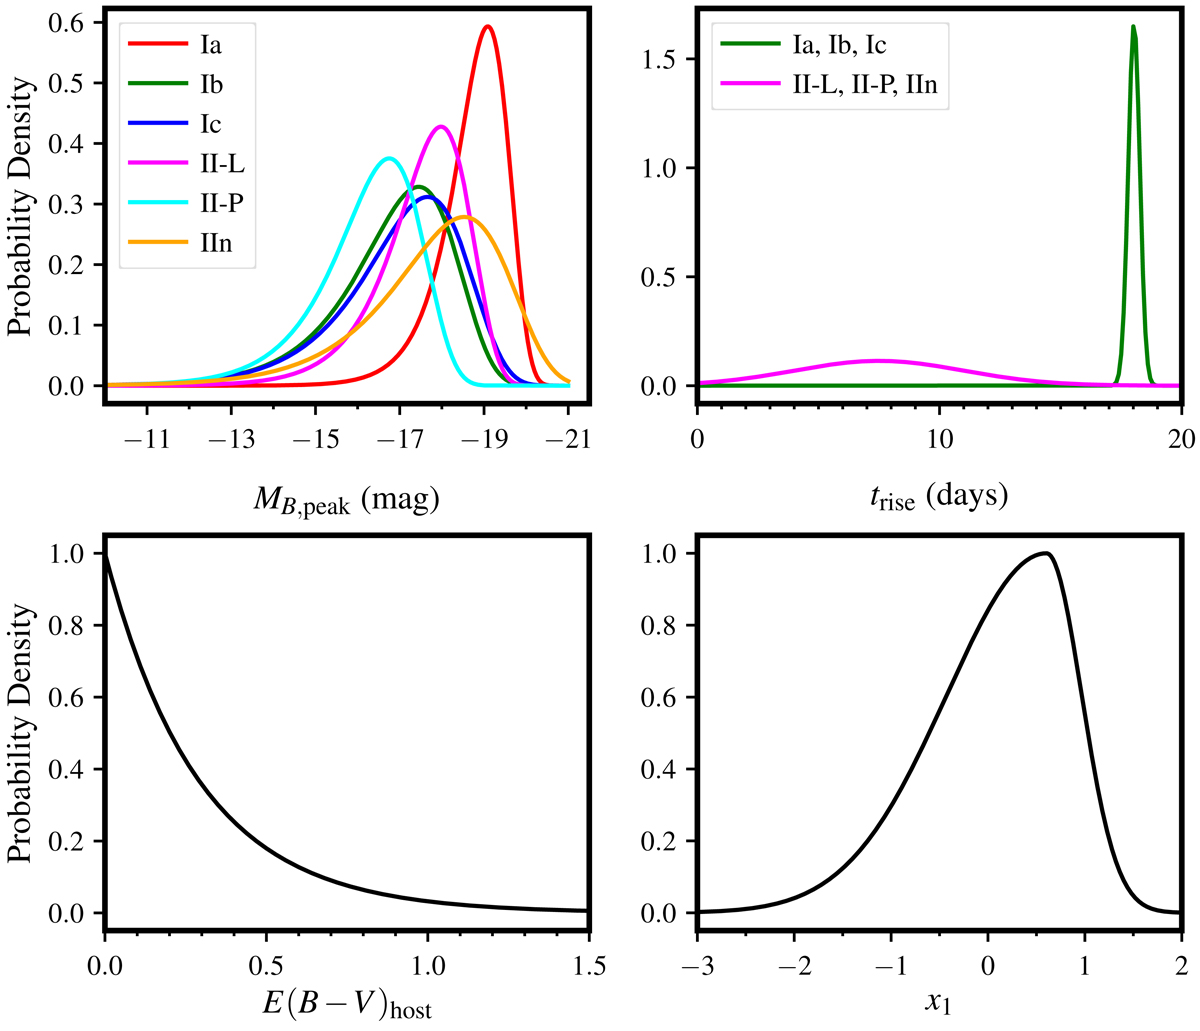
Curves of the probability density functions from which the various parameters used for the Monte Carlo analysis were drawn. Clockwise, starting at the top-left, these are: the peak magnitude of the supernova in B-band, MB, peak; the rest-frame rise time of the supernova, trise; the Type Ia SN stretch parameter x1; and the host galaxy reddening parameter E(B − V)host.
Current usage metrics show cumulative count of Article Views (full-text article views including HTML views, PDF and ePub downloads, according to the available data) and Abstracts Views on Vision4Press platform.
Data correspond to usage on the plateform after 2015. The current usage metrics is available 48-96 hours after online publication and is updated daily on week days.
Initial download of the metrics may take a while.