Fig. 3.
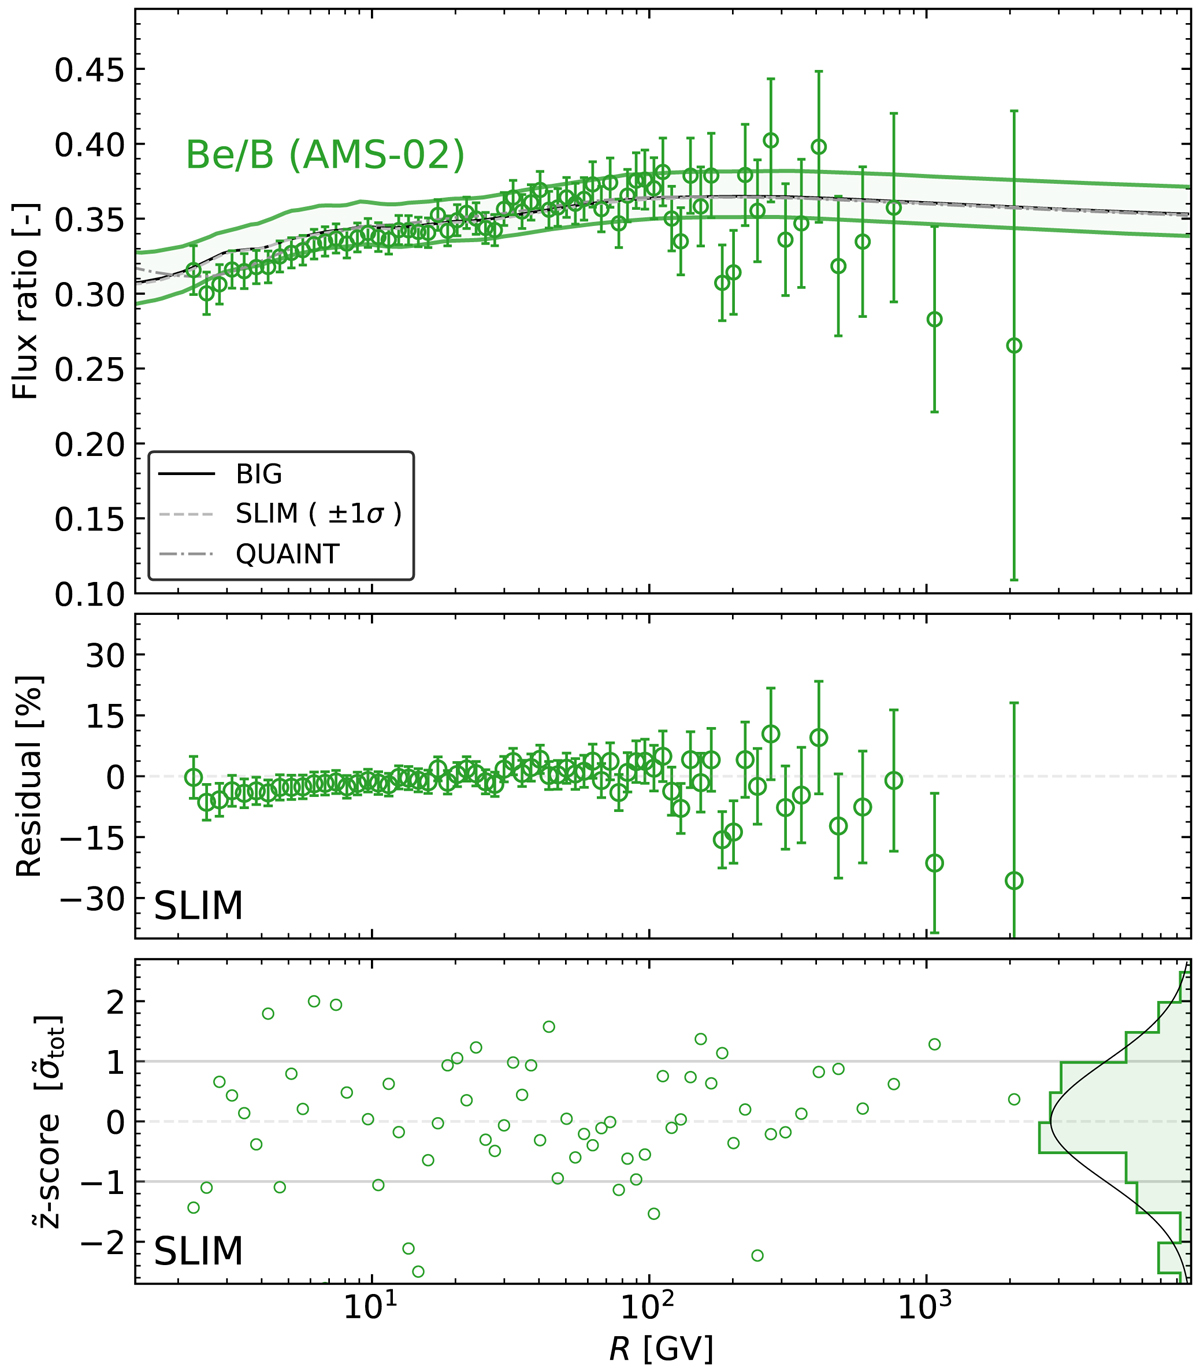
Model prediction (top), residuals (centre), and ![]() -score (bottom) for Be/B based on the best-fit parameters to B/C, Li/C, 10Be/9Be, 10Be/Be and Be/B data. In the top panel, the contours show the 1σ total model uncertainties for BIG. In the bottom panel, the right-hand side shows the distribution of
-score (bottom) for Be/B based on the best-fit parameters to B/C, Li/C, 10Be/9Be, 10Be/Be and Be/B data. In the top panel, the contours show the 1σ total model uncertainties for BIG. In the bottom panel, the right-hand side shows the distribution of ![]() values against a Gaussian with unit width (solid lines).
values against a Gaussian with unit width (solid lines).
Current usage metrics show cumulative count of Article Views (full-text article views including HTML views, PDF and ePub downloads, according to the available data) and Abstracts Views on Vision4Press platform.
Data correspond to usage on the plateform after 2015. The current usage metrics is available 48-96 hours after online publication and is updated daily on week days.
Initial download of the metrics may take a while.