Fig. 1.
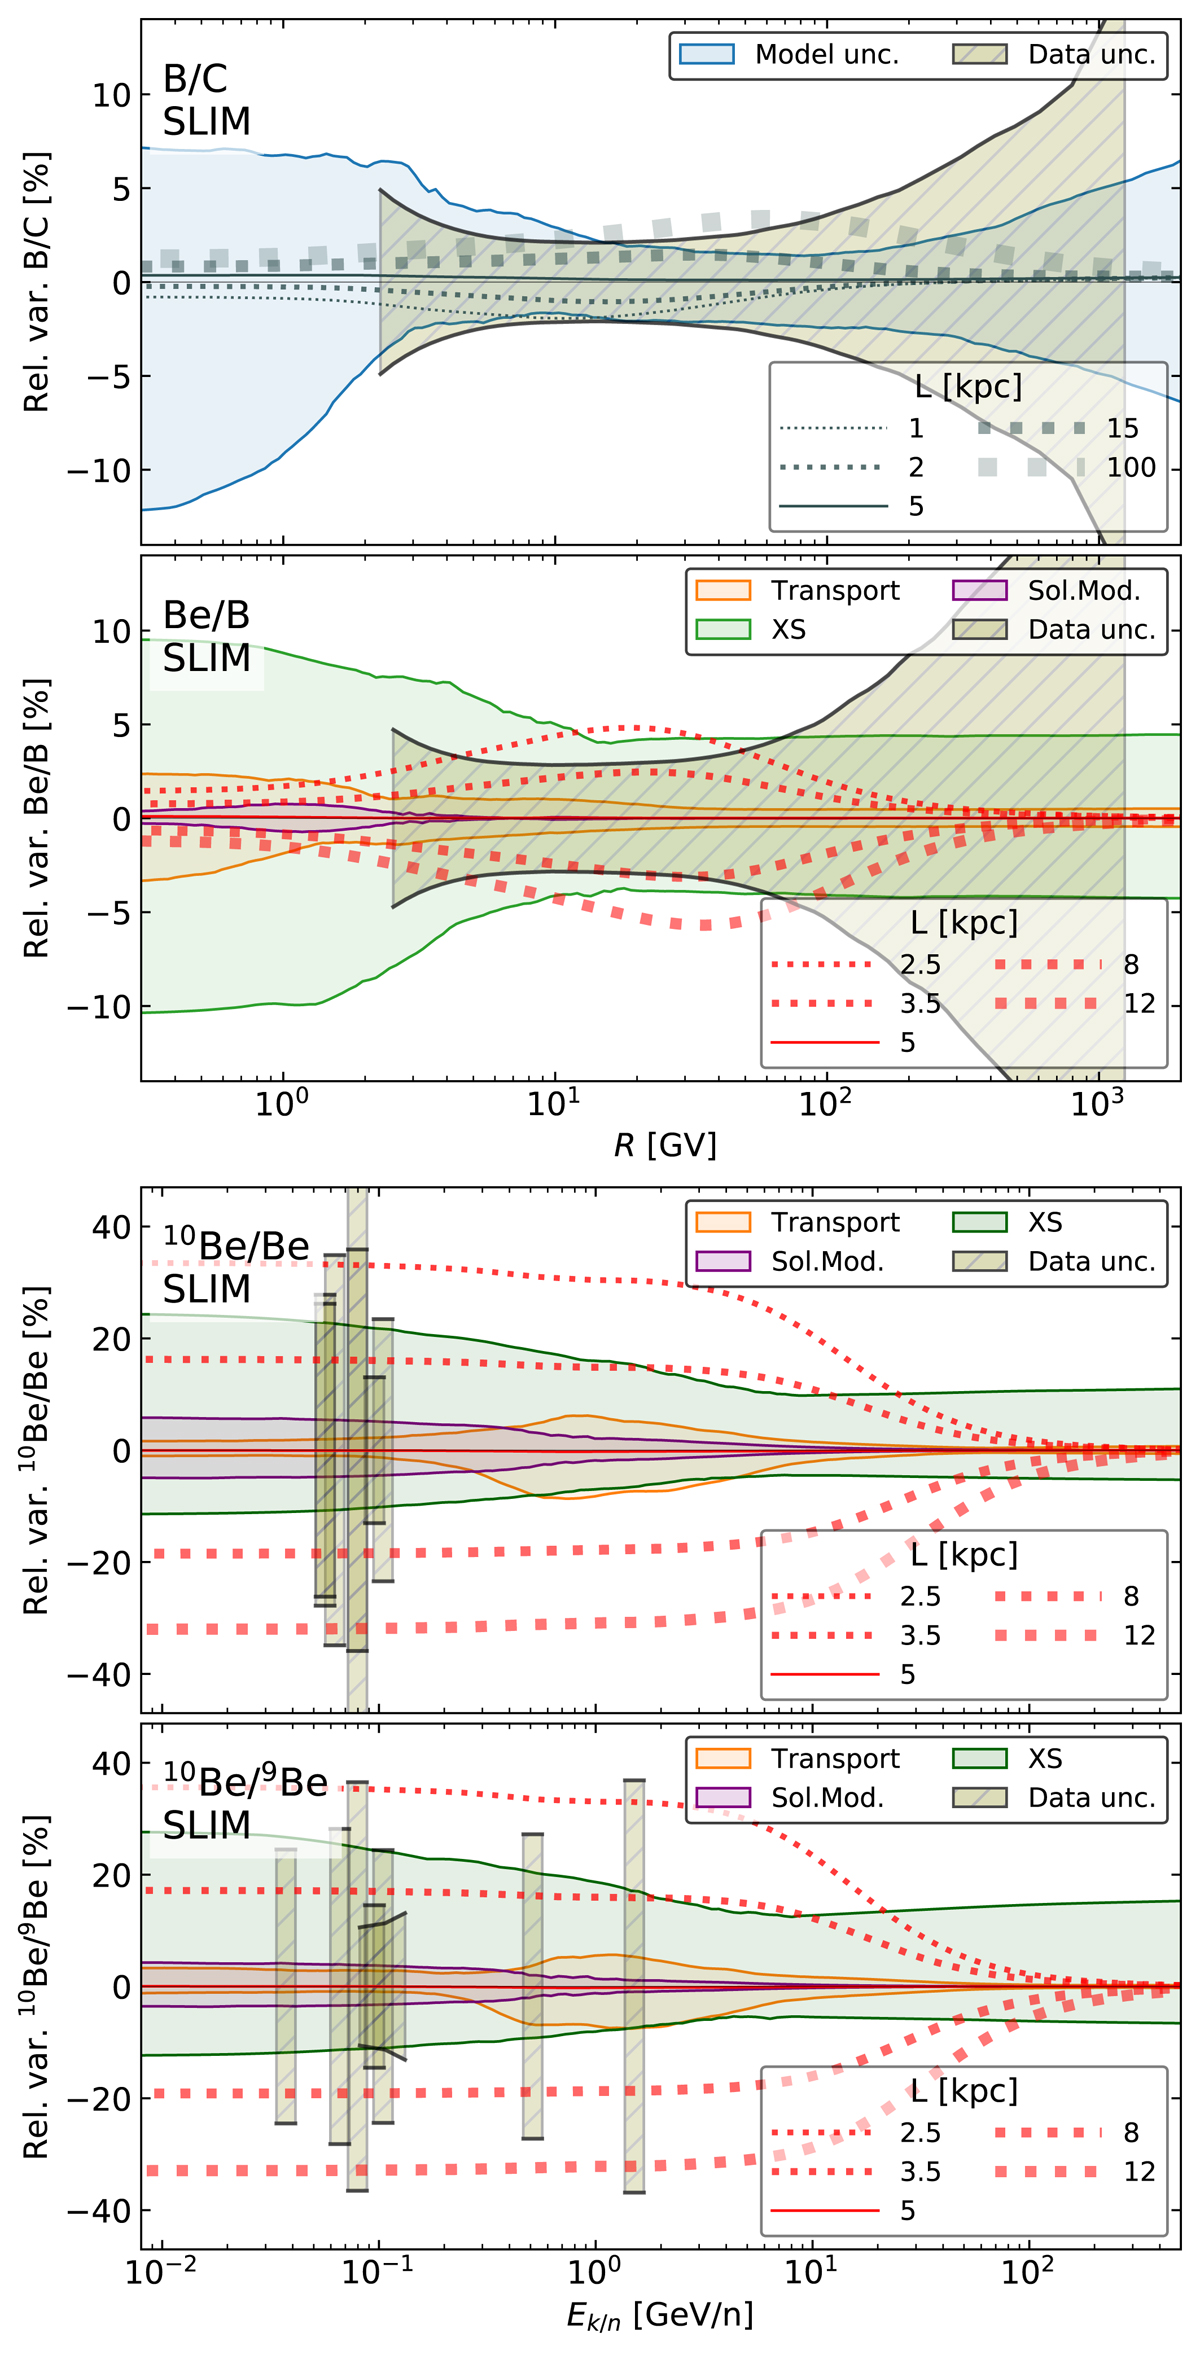
Relative variation of B/C, Be/B, 10Be/Be, and 10Be/9Be ratios (from top to bottom) as a function of rigidity (upper panels) or kinetic energy per nucleon (lower panels). All the panels compare three different effects: (i) the thin- to thick-dashed lines correspond, at constant grammage, to the impact of L on the calculated ratios (the reference is L = 5 kpc); (ii) hatched boxes show the data relative uncertainties over the data energy coverage (AMS-02 data in the two top panels) or for central energy points only (ACE, IMP7&8, ISEE3, ISOMAX, Ulysses, and Voyager1&2 data in the two bottom panels) – see Sect. 3.1 and Table 2 for data references; (iii) the remaining envelopes show 68% CLs on model calculations, including transport, cross sections, and modulation uncertainties separately or combined (“total”).
Current usage metrics show cumulative count of Article Views (full-text article views including HTML views, PDF and ePub downloads, according to the available data) and Abstracts Views on Vision4Press platform.
Data correspond to usage on the plateform after 2015. The current usage metrics is available 48-96 hours after online publication and is updated daily on week days.
Initial download of the metrics may take a while.