Free Access
Fig. 8.
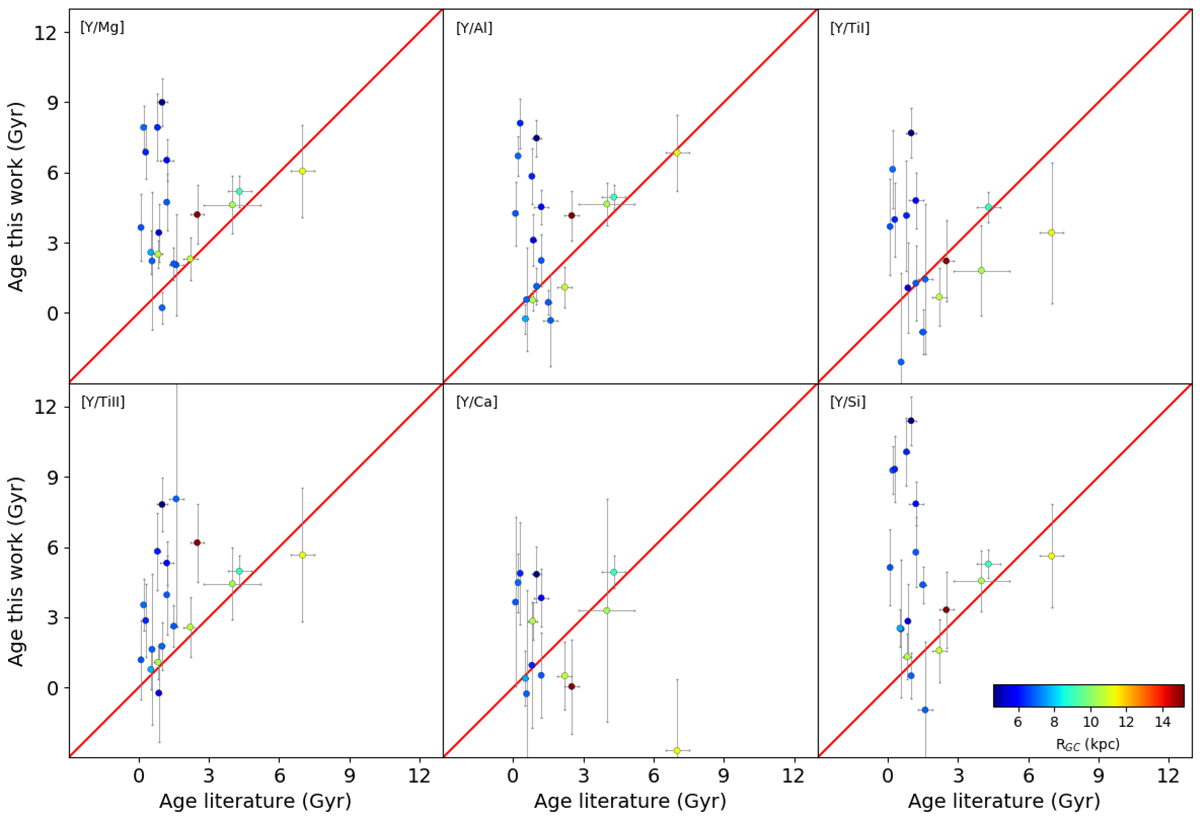
Comparison between the ages from the literature and the ages inferred in the present work for the open clusters. The symbols are colour-coded by their Galactocentric distances. We note that we only show positive upper limit ages in this plot.
Current usage metrics show cumulative count of Article Views (full-text article views including HTML views, PDF and ePub downloads, according to the available data) and Abstracts Views on Vision4Press platform.
Data correspond to usage on the plateform after 2015. The current usage metrics is available 48-96 hours after online publication and is updated daily on week days.
Initial download of the metrics may take a while.