Fig. 4.
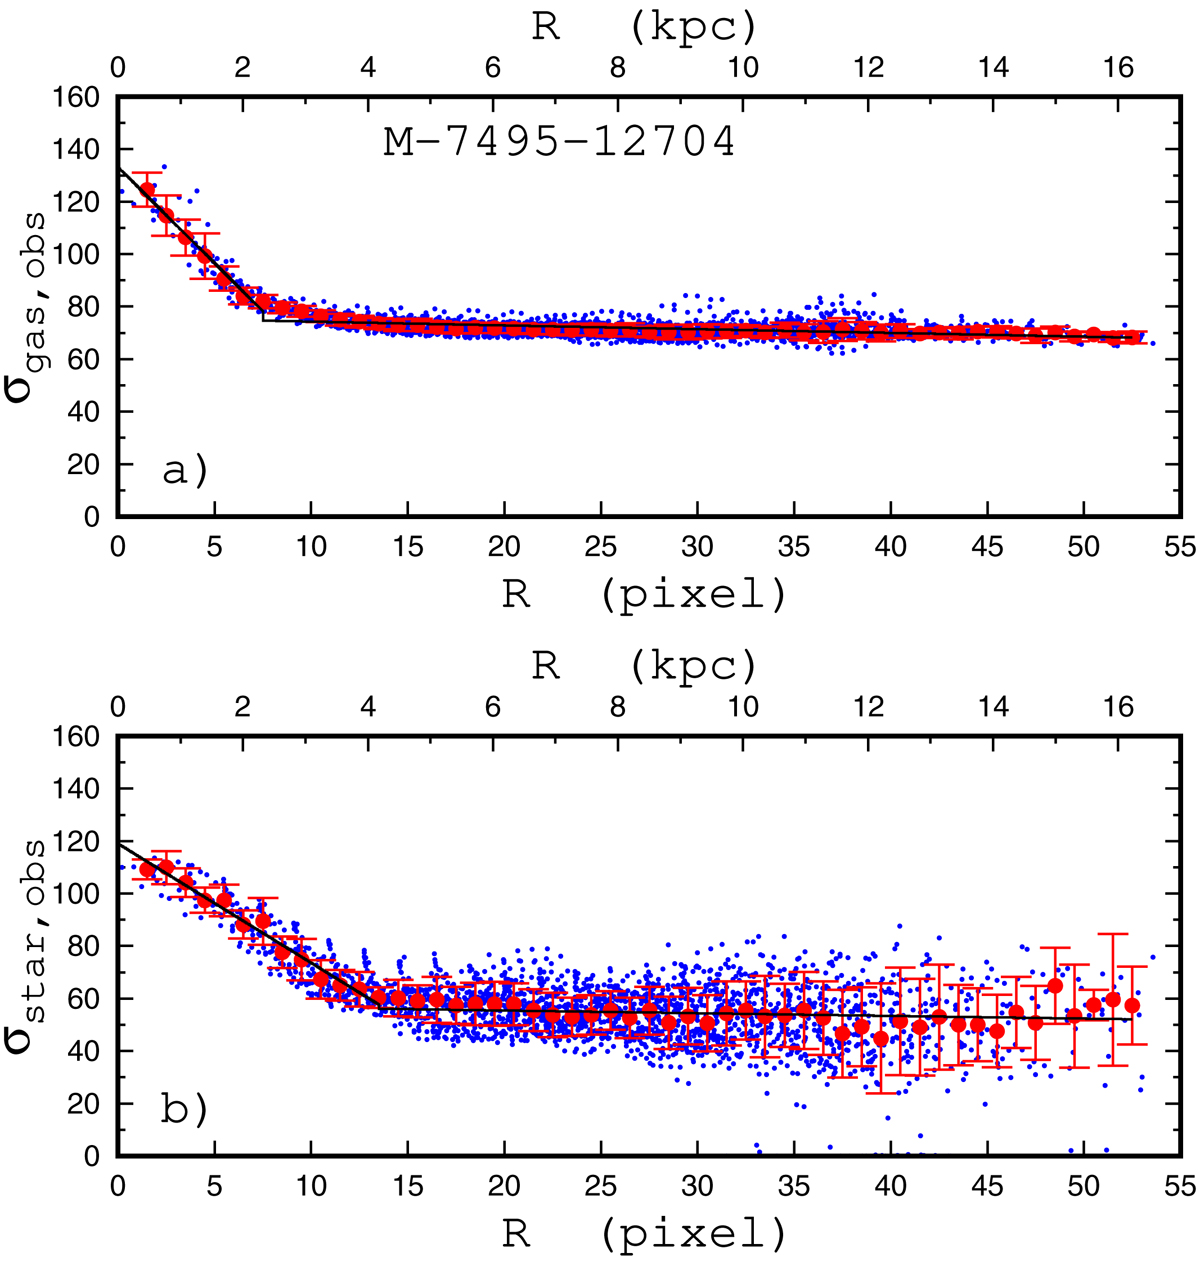
Determination of the radii of the zones of the enhanced gas and stellar velocity dispersions. Panel a: observed (non corrected for the instrumental profile) gas velocity dispersion σgas, obs as a function of radius for individual spaxels (blue points) and median values of σgas, obs with the mean deviations (red points and bars) for intervals corresponding to the width of 1 spaxel. The broken line is the fit to the median values of σgas, obs. Panel b: same as panel a but for the observed stellar velocity dispersion σstar, obs.
Current usage metrics show cumulative count of Article Views (full-text article views including HTML views, PDF and ePub downloads, according to the available data) and Abstracts Views on Vision4Press platform.
Data correspond to usage on the plateform after 2015. The current usage metrics is available 48-96 hours after online publication and is updated daily on week days.
Initial download of the metrics may take a while.