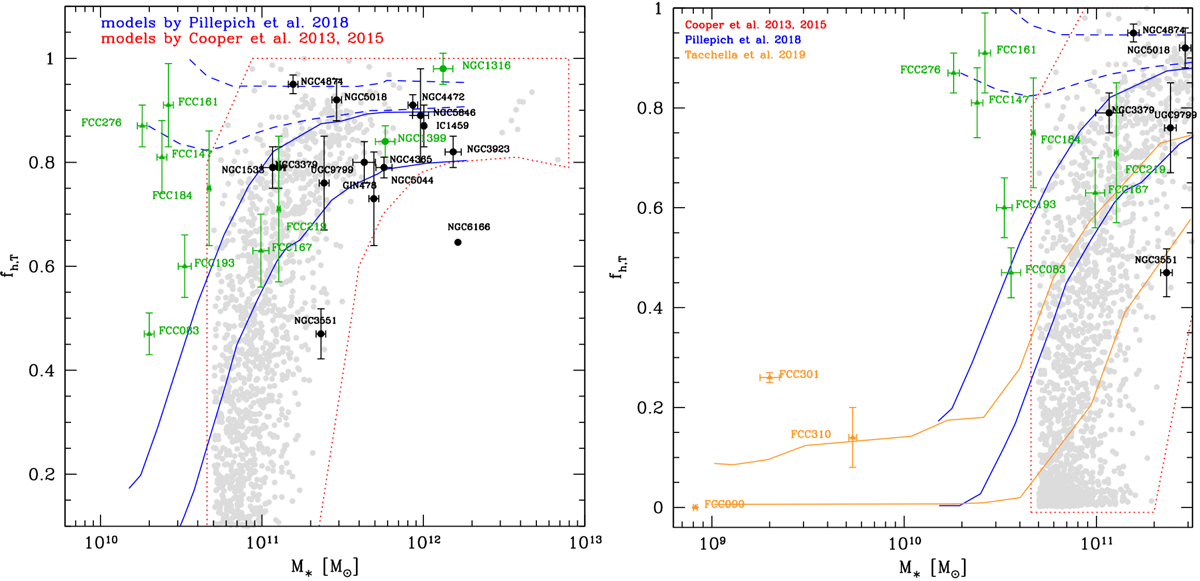
Fig. 8.

Left panel: accreted mass fraction vs. total stellar mass for ETGs. The measurements for FDS galaxies analysed in this work are given as green triangles. The green circles correspond to the FDS galaxies NGC1399 and NGC1316, published by Iodice et al. (2016, 2017b). The black circles correspond to other BCGs from the literature (Seigar et al. 2007; Bender et al. 2015; Spavone et al. 2017, 2018; Iodice et al. 2020; Cattapan et al. 2019). The red region, enclosing grey dots, indicates the predictions of cosmological galaxy formation simulations by Cooper et al. (2013, 2015). The blue continuous and dashed regions indicate the accreted mass fraction measured within 30 kpc and outside 100 kpc, respectively, in Illustris simulations by Pillepich et al. 2018 (see their Fig. 12). Right panel: same as the left panel for less massive galaxies in the FDS sample (orange triangles). Orange regions indicate the accreted mass fraction for low-mass galaxies in Illustris TNG simulations by Tacchella et al. (2019).
Current usage metrics show cumulative count of Article Views (full-text article views including HTML views, PDF and ePub downloads, according to the available data) and Abstracts Views on Vision4Press platform.
Data correspond to usage on the plateform after 2015. The current usage metrics is available 48-96 hours after online publication and is updated daily on week days.
Initial download of the metrics may take a while.


