Fig. 7.
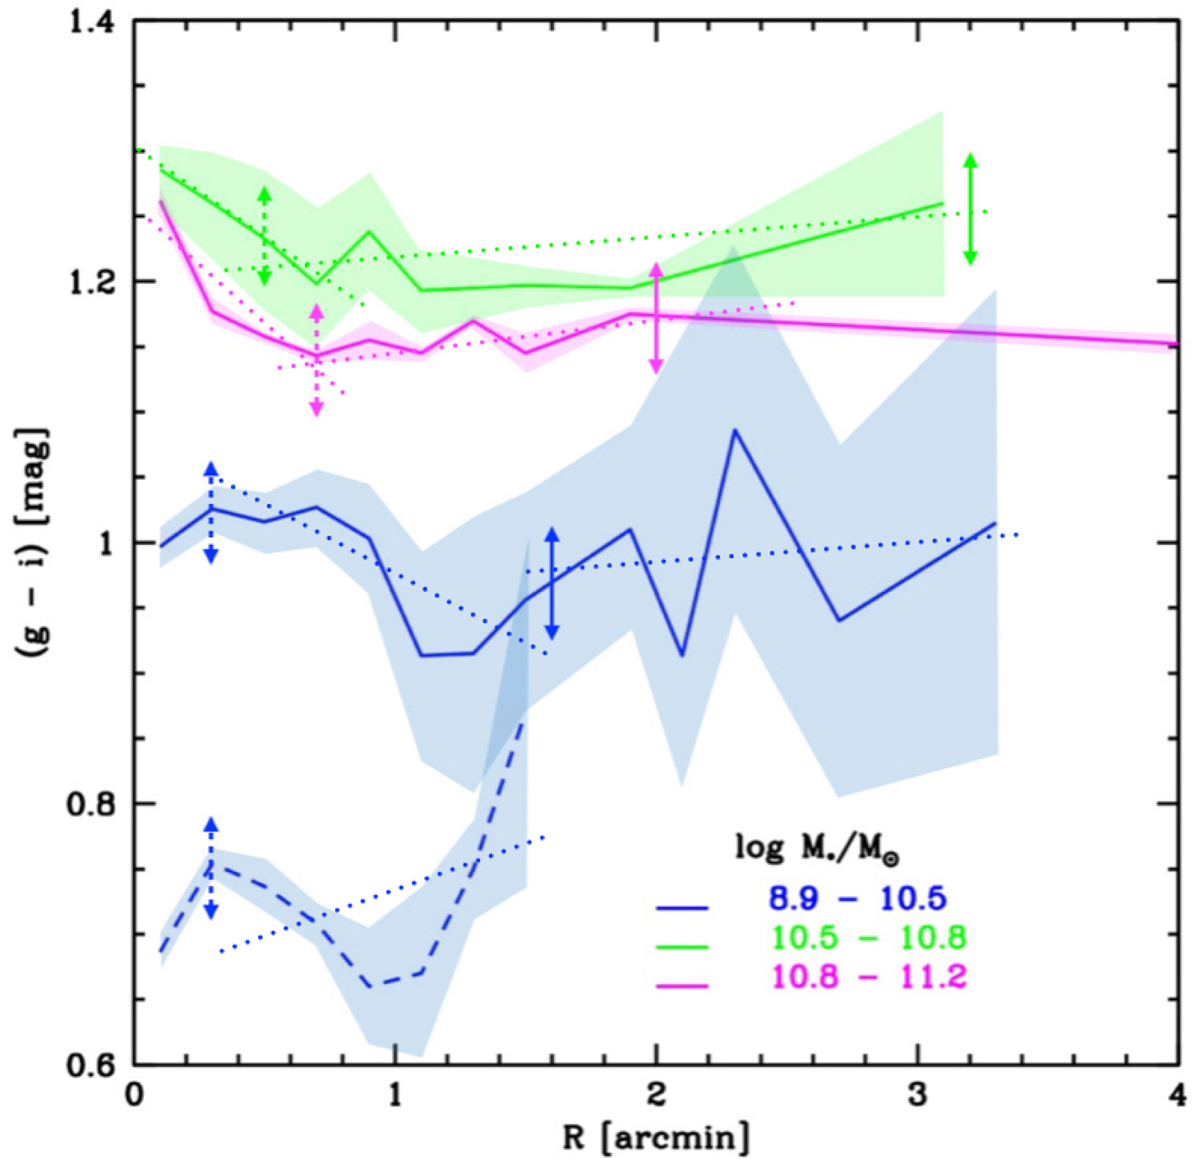
Running mean of the average (g − i) colour profiles of the ETGs in Fornax, in three different mass bins: 8.9 ≤ log M*/M⊙ ≤ 10.5 (blue), 10.5 ≤ log M*/M⊙ ≤ 10.8 (green), and 10.8 ≤ log M*/M⊙ ≤ 11.2 (magenta). Blue dashed line indicates galaxies in the low-density region, while the blue continuous line indicates those in the high-density region of the cluster. The dashed and the continuous vertical arrows denote the position of the average transition radii, Rtr1 and Rtr2 respectively, in each mass bin. The dotted lines represent the fits to the colour gradients between transition radii.
Current usage metrics show cumulative count of Article Views (full-text article views including HTML views, PDF and ePub downloads, according to the available data) and Abstracts Views on Vision4Press platform.
Data correspond to usage on the plateform after 2015. The current usage metrics is available 48-96 hours after online publication and is updated daily on week days.
Initial download of the metrics may take a while.