Fig. 6.
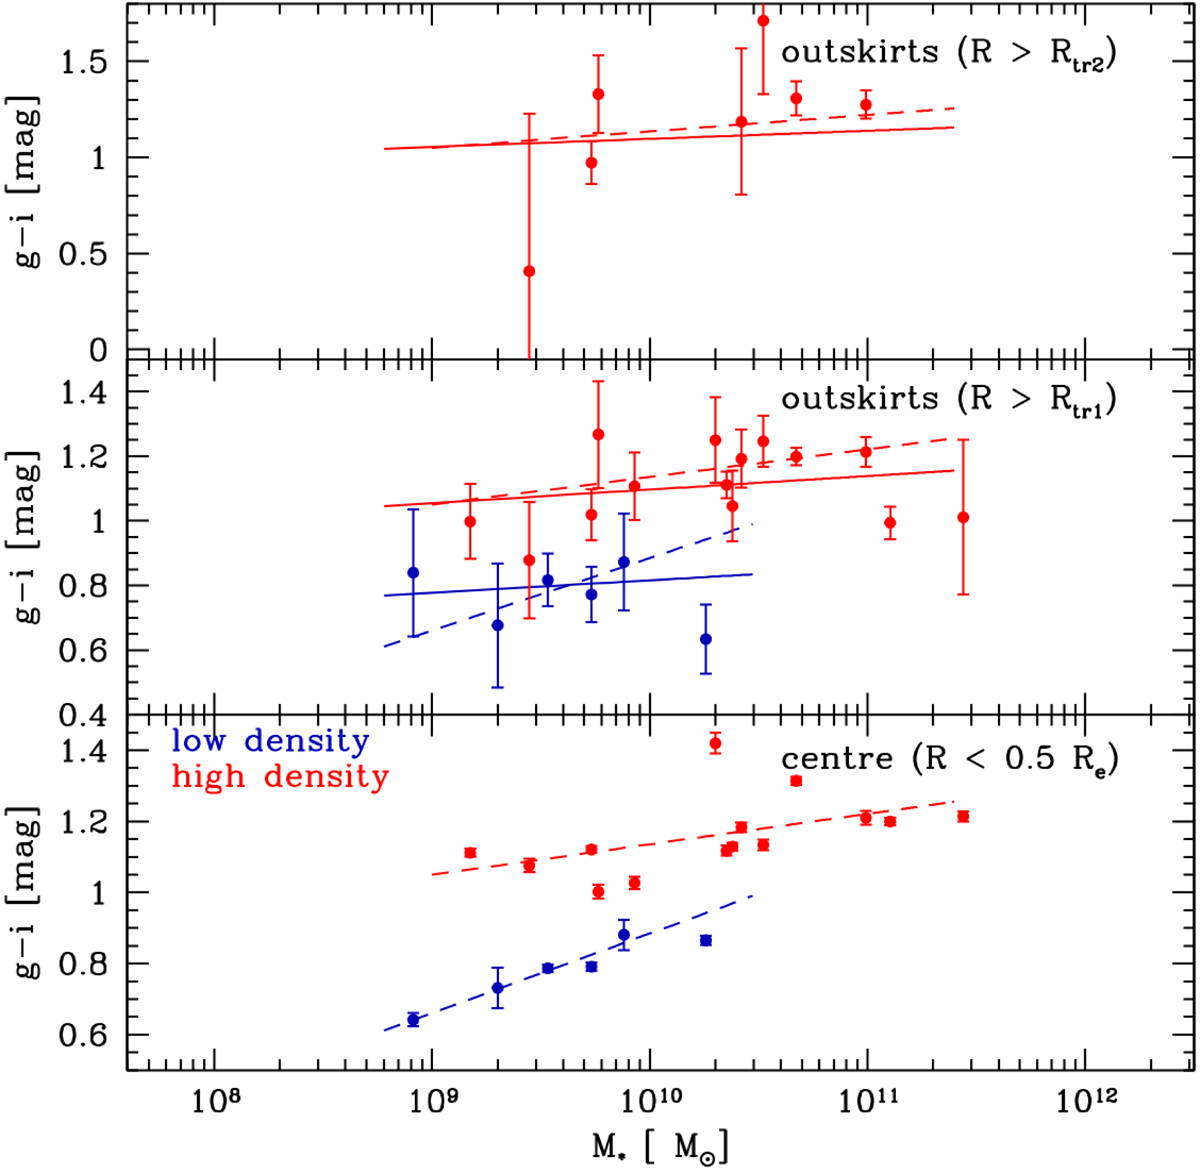
Average colours (g − i) for the central parts (R < 0.5Re, bottom panel), for R > Rtr1 (middle panel), and for R > Rtr2 (top panel) of the FDS ETGs located in the high- (red circles) and low-density region (blue circles) of the cluster as a function of the total stellar mass. The red and blue dashed lines in all the panels represent the least-square fits of the values for the central parts (R < 0.5Re) of the ETGs in the high- and low-density regions of the cluster, respectively. The continuous red and blue lines in the middle panel are the least-square fits of the values for R > Rtr1, while the dashed and the continuous red lines in the top panel are the least-square fits of the values for R < 0.5Re and R > Rtr1, respectively.
Current usage metrics show cumulative count of Article Views (full-text article views including HTML views, PDF and ePub downloads, according to the available data) and Abstracts Views on Vision4Press platform.
Data correspond to usage on the plateform after 2015. The current usage metrics is available 48-96 hours after online publication and is updated daily on week days.
Initial download of the metrics may take a while.