Fig. 5.
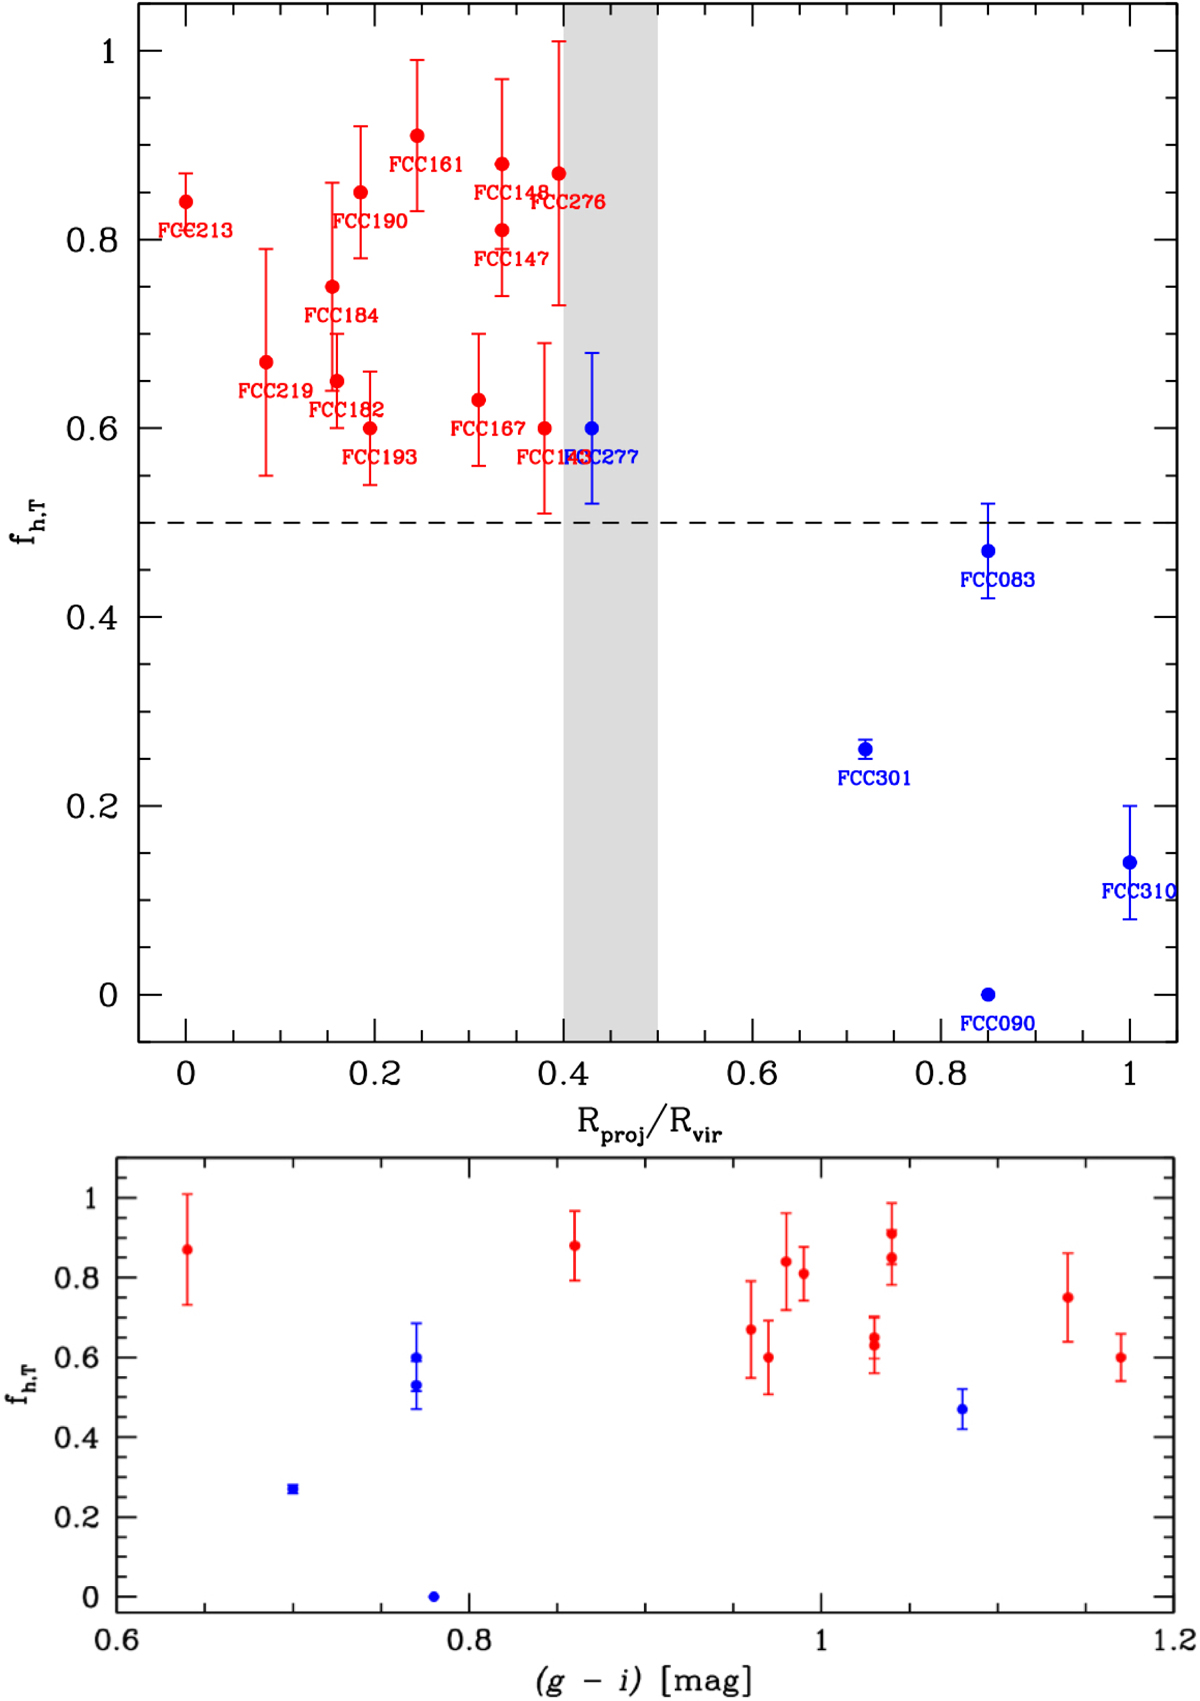
Top panel: accreted mass fraction as a function the projected distance from the cluster centre, normalised to the virial radius of the cluster (Rvir = 0.7 Mpc, Drinkwater et al. 2001). Red dots indicate galaxies in the high-density region of the cluster, while blue dots indicate galaxies in the low-density region. The vertical grey region shows the range of cluster-centric distance where a clear separation occurs: galaxies located inside ∼0.8–1 degree from the core of the cluster show a higher outer envelope mass fraction. Bottom panel: accreted mass fraction as a function of the (g − i) average colour for galaxies in the low- (blues dots) and high- (red dots) density regions of the cluster. On average, redder galaxies have higher accreted mass fractions. FCC 277 is in the transition region from high-to-low density; this region has a higher accreted mass fraction, but has colours comparable with galaxies in the low-density region.
Current usage metrics show cumulative count of Article Views (full-text article views including HTML views, PDF and ePub downloads, according to the available data) and Abstracts Views on Vision4Press platform.
Data correspond to usage on the plateform after 2015. The current usage metrics is available 48-96 hours after online publication and is updated daily on week days.
Initial download of the metrics may take a while.