Fig. 4.
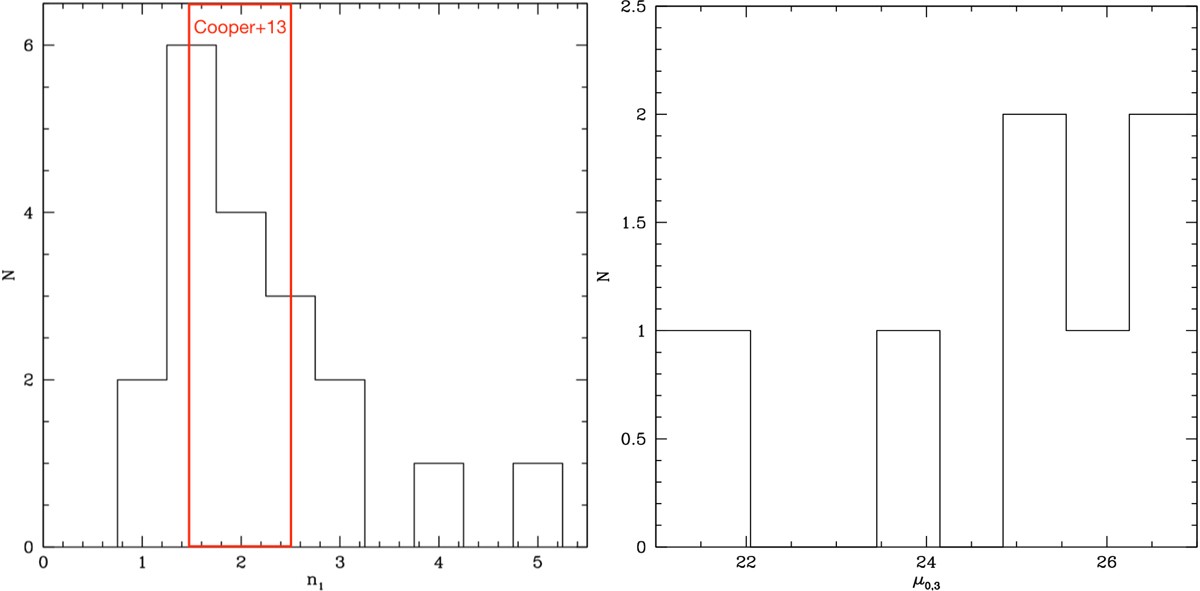
Left panel: distribution of the Sérsic index of the innermost component of our fit for the 19 analysed galaxies. The red region brackets the range of n1 in the simulations by Cooper et al. (2013). Right panel: distribution of the central surface brightness of the 8 galaxies in the sample having a third exponential component (μ0, 3).
Current usage metrics show cumulative count of Article Views (full-text article views including HTML views, PDF and ePub downloads, according to the available data) and Abstracts Views on Vision4Press platform.
Data correspond to usage on the plateform after 2015. The current usage metrics is available 48-96 hours after online publication and is updated daily on week days.
Initial download of the metrics may take a while.