Fig. A.1.
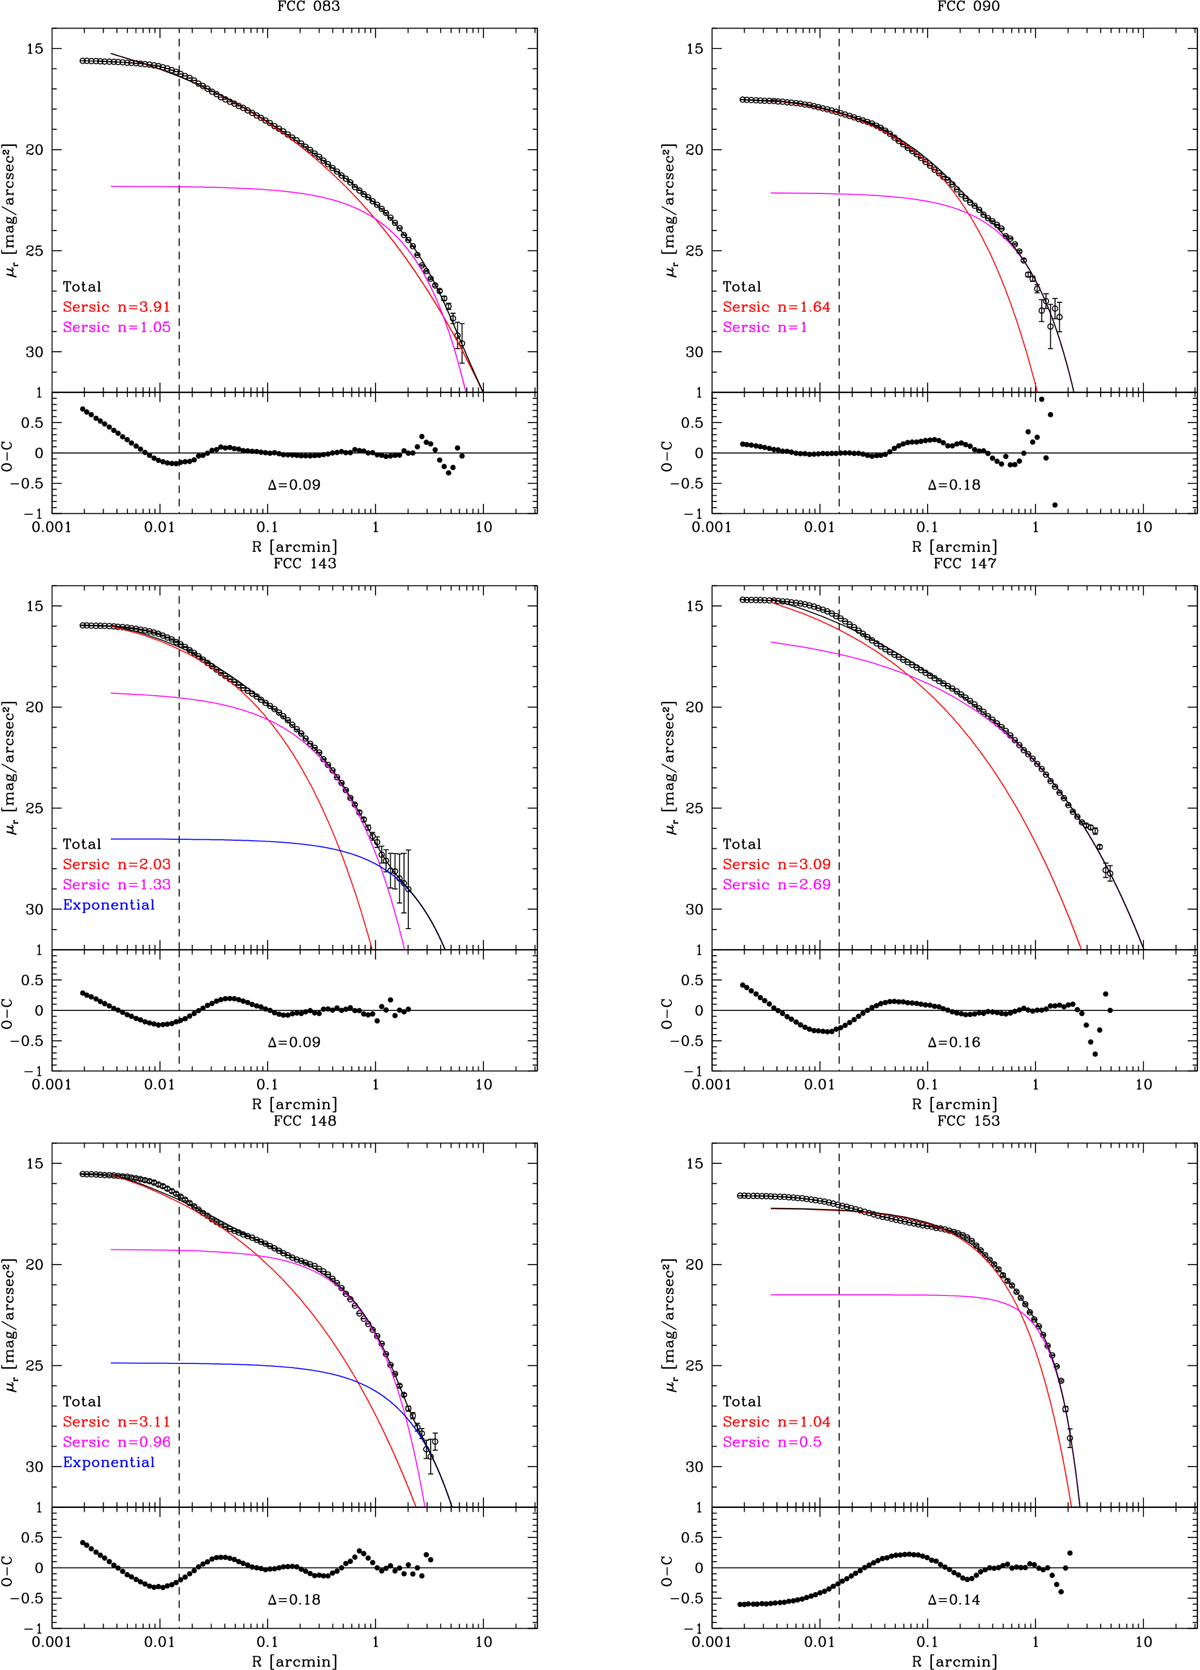
Top panels: deconvolved VST r-band profiles of ETGs in FDS plotted on a logarithmic scale. The blue line indicates a fit to the outer regions. The red and magenta lines indicate a fit to the inner and middle regions with a Sérsic profile, and the black line indicates the sum of the components from each fit. The dotted line indicates the core of the galaxy, which was excluded in the fit. Bottom panels: Δ rms scatter (see text for details).
Current usage metrics show cumulative count of Article Views (full-text article views including HTML views, PDF and ePub downloads, according to the available data) and Abstracts Views on Vision4Press platform.
Data correspond to usage on the plateform after 2015. The current usage metrics is available 48-96 hours after online publication and is updated daily on week days.
Initial download of the metrics may take a while.