Fig. 1.
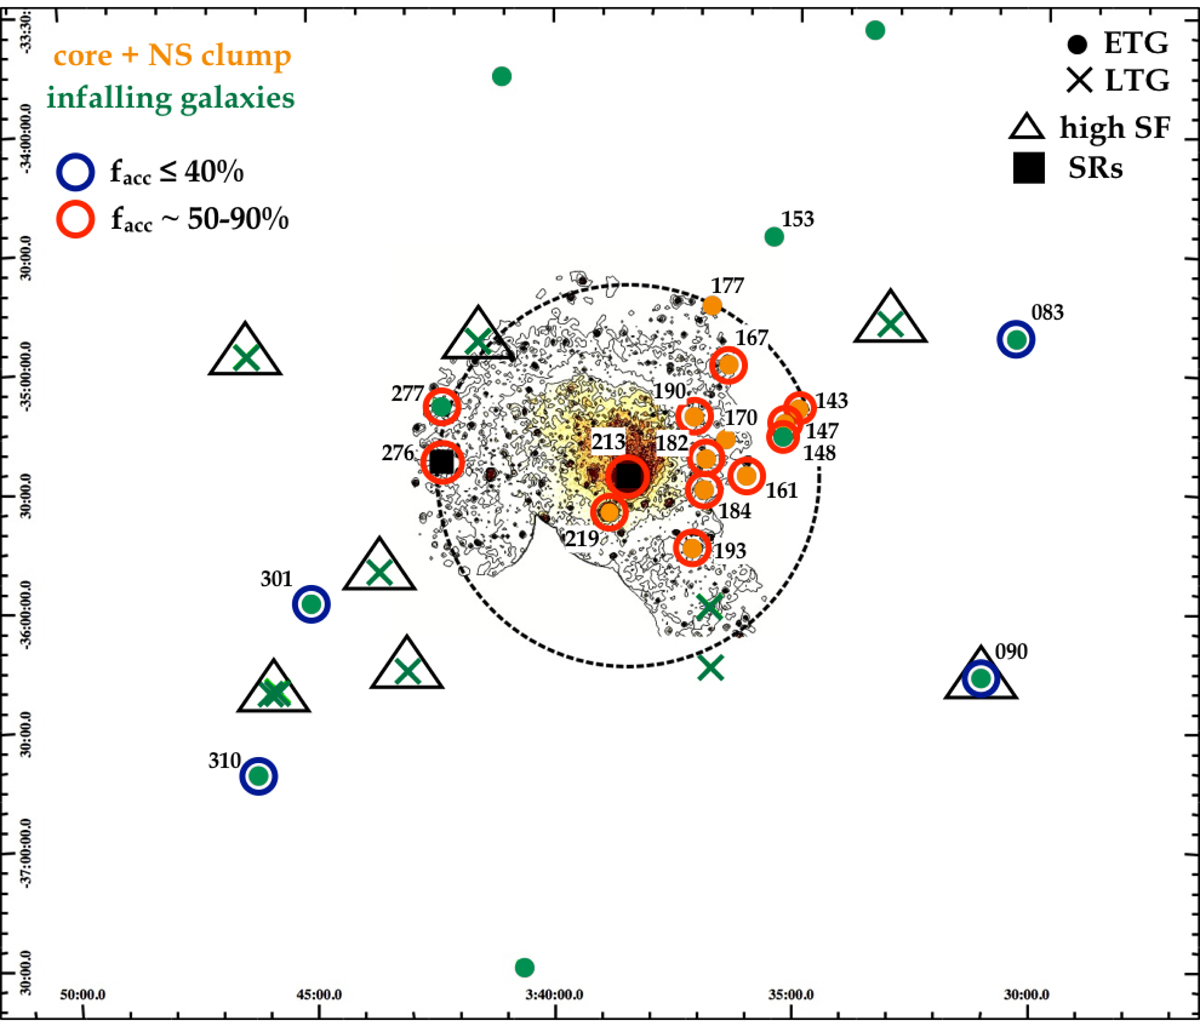
Distribution of the brightest (mB ≤ 16 mag) ETGs (circles) and LTGs (crosses) of the Fornax cluster inside the virial radius, projected onto the sky plane. All ETGs studied in this paper are labelled with their FCC number (see Table 1). The right ascension and declination (J2000.0) are given in degrees on the horizontal and vertical axes of the field of view, respectively. The background image (and contours) is the X-ray emission in the energy range 0.4–1.3 KeV as measured by XMM-Newton (Frank et al. 2013). The dashed circle indicates the transition from the high-to-low density region of the cluster at 0.3 Mpc ≃0.4 Rvir. The orange and green symbols represent the galaxies residing in the NS clump and the infalling galaxies, respectively (see text for details). Galaxies with high star formation (black open triangles) are also shown (Iodice et al. 2019a). The two slow rotators (SRs), FCC 213 and FCC 276, are denoted with black squares. Open blue and red circles indicate the fraction of the accreted mass estimated in this work. For the three edge-on lenticular galaxies FCC153, FCC170, FCC177 the accreted fraction could not be determined.
Current usage metrics show cumulative count of Article Views (full-text article views including HTML views, PDF and ePub downloads, according to the available data) and Abstracts Views on Vision4Press platform.
Data correspond to usage on the plateform after 2015. The current usage metrics is available 48-96 hours after online publication and is updated daily on week days.
Initial download of the metrics may take a while.