Fig. 6.
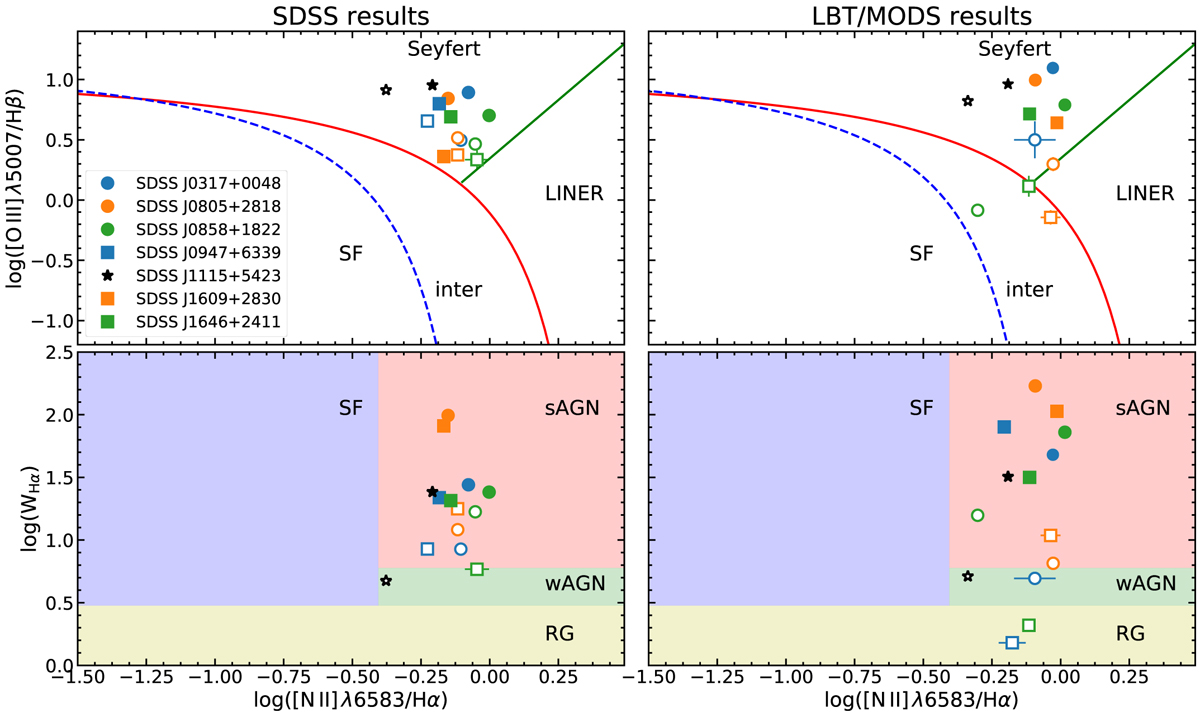
Comparison of emission-line diagnostics for the two nuclei from SDSS data (left panels) and LBT long slits (right panels). Top panels: classical BPT diagnostic diagram with demarcation lines overplotted from Kewley et al. (2001; red line), Kauffmann et al. (2003a; blue line), and (Stasińska et al. 2008; green line), which define areas of star forming galaxies (SF), Seyfert galaxies, LINERs, and intermediate (inter) galaxies. Bottom panels: emission-line diagnostic diagram using the equivalent width of Hα replacing the [O III]/Hβ ratio following Cid Fernandes et al. (2010). The classification scheme for SF galaxies, strong AGN (sAGN), weak AGN (wAGN), and retired galaxies (RG) is adopted from Cid Fernandes et al. (2011). The nuclei with the brighter [O III] emission line are shown with filled symbols, while the corresponding fainter nuclei are denoted with open symbols.
Current usage metrics show cumulative count of Article Views (full-text article views including HTML views, PDF and ePub downloads, according to the available data) and Abstracts Views on Vision4Press platform.
Data correspond to usage on the plateform after 2015. The current usage metrics is available 48-96 hours after online publication and is updated daily on week days.
Initial download of the metrics may take a while.