Fig. 5.
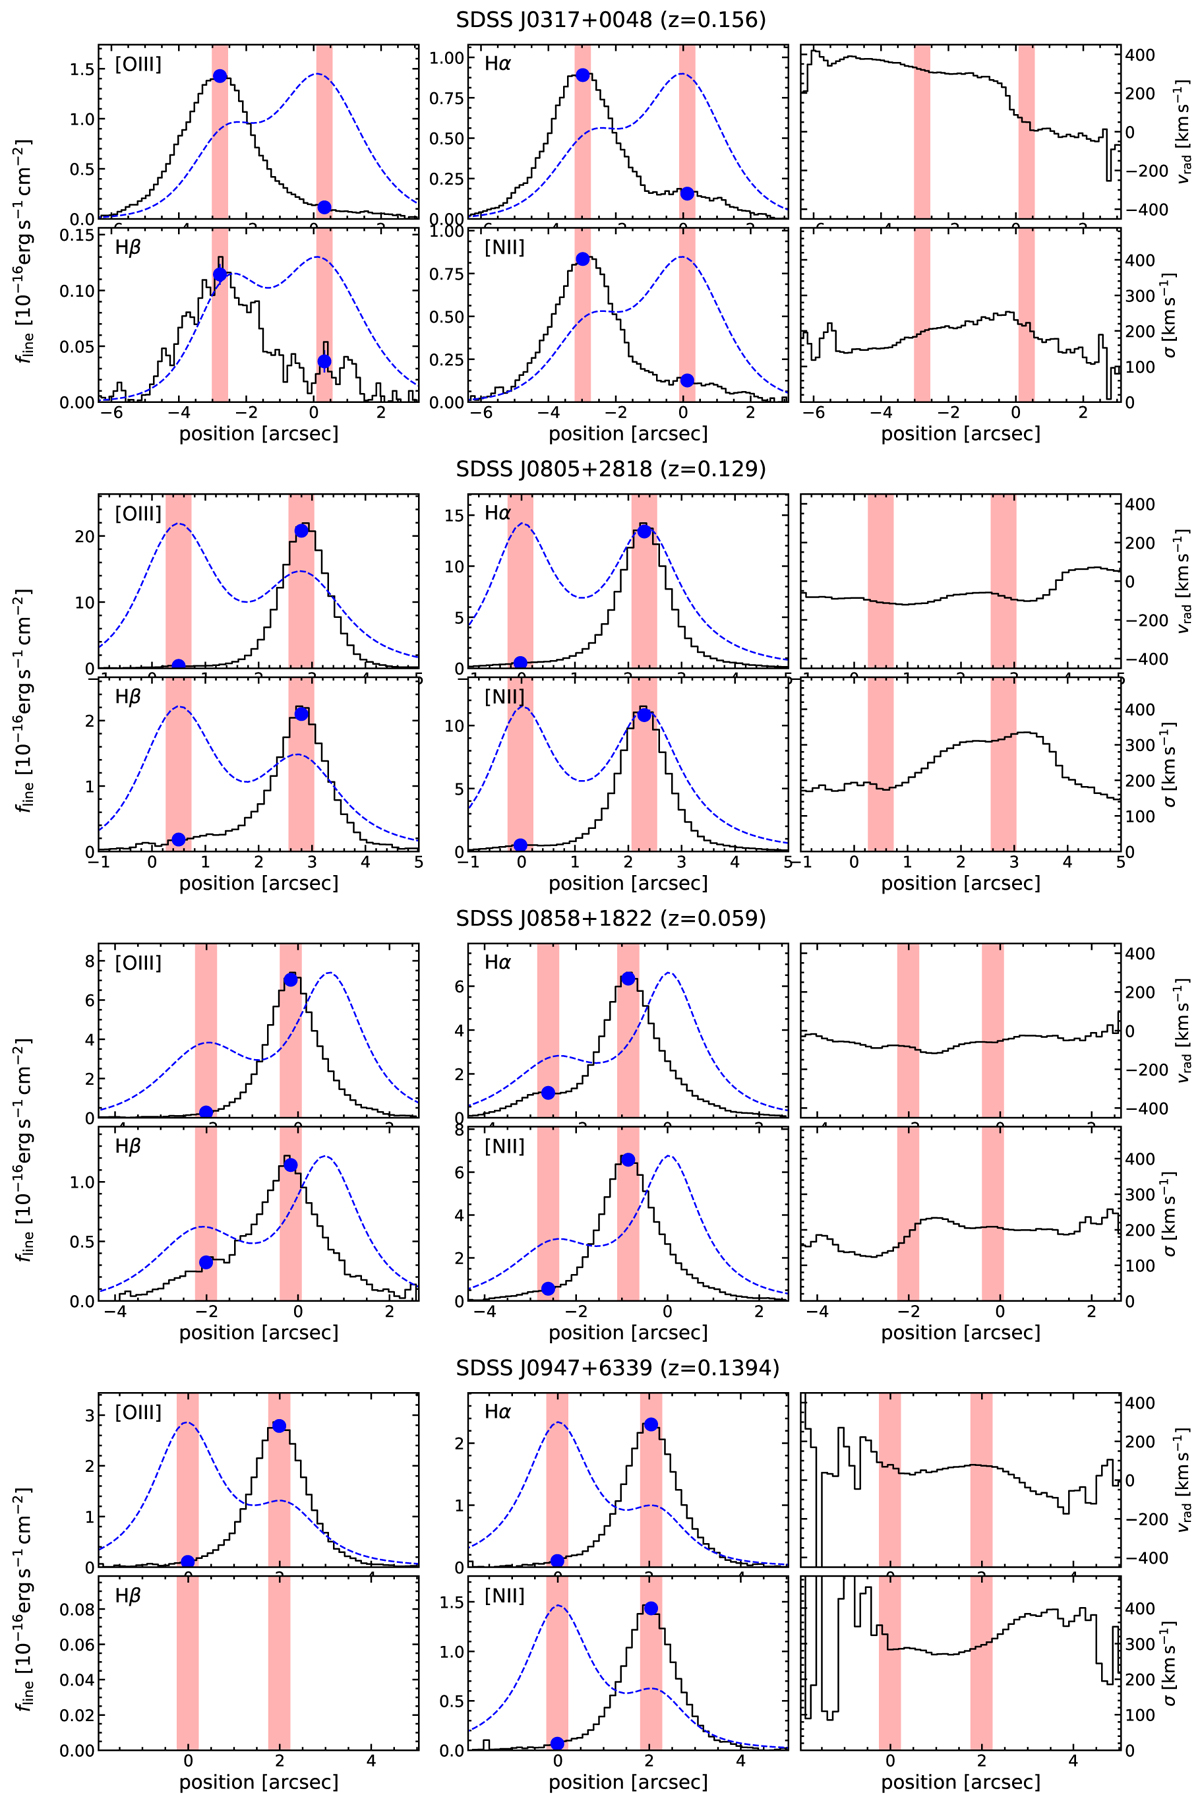
Overview of the emission-line fluxes and kinematics along the slit. The four left panels for each object show the 1D flux distributions for Hβ, [O III], Hα, and [N II] as black curves with the dashed blue line highlighting the continuum flux distribution for comparison. The red bands show the 0![]() 4-wide apertures used to obtain average line fluxes centred on the nuclei of the merging galaxies. The blue points represent the measured fluxes in those aperture including an error-bar based on flux variations. The two right panels present the position-velocity and the position-velocity dispersion curves for each object. Average kinematics are also measured within the same apertures.
4-wide apertures used to obtain average line fluxes centred on the nuclei of the merging galaxies. The blue points represent the measured fluxes in those aperture including an error-bar based on flux variations. The two right panels present the position-velocity and the position-velocity dispersion curves for each object. Average kinematics are also measured within the same apertures.
Current usage metrics show cumulative count of Article Views (full-text article views including HTML views, PDF and ePub downloads, according to the available data) and Abstracts Views on Vision4Press platform.
Data correspond to usage on the plateform after 2015. The current usage metrics is available 48-96 hours after online publication and is updated daily on week days.
Initial download of the metrics may take a while.