Fig. 4.
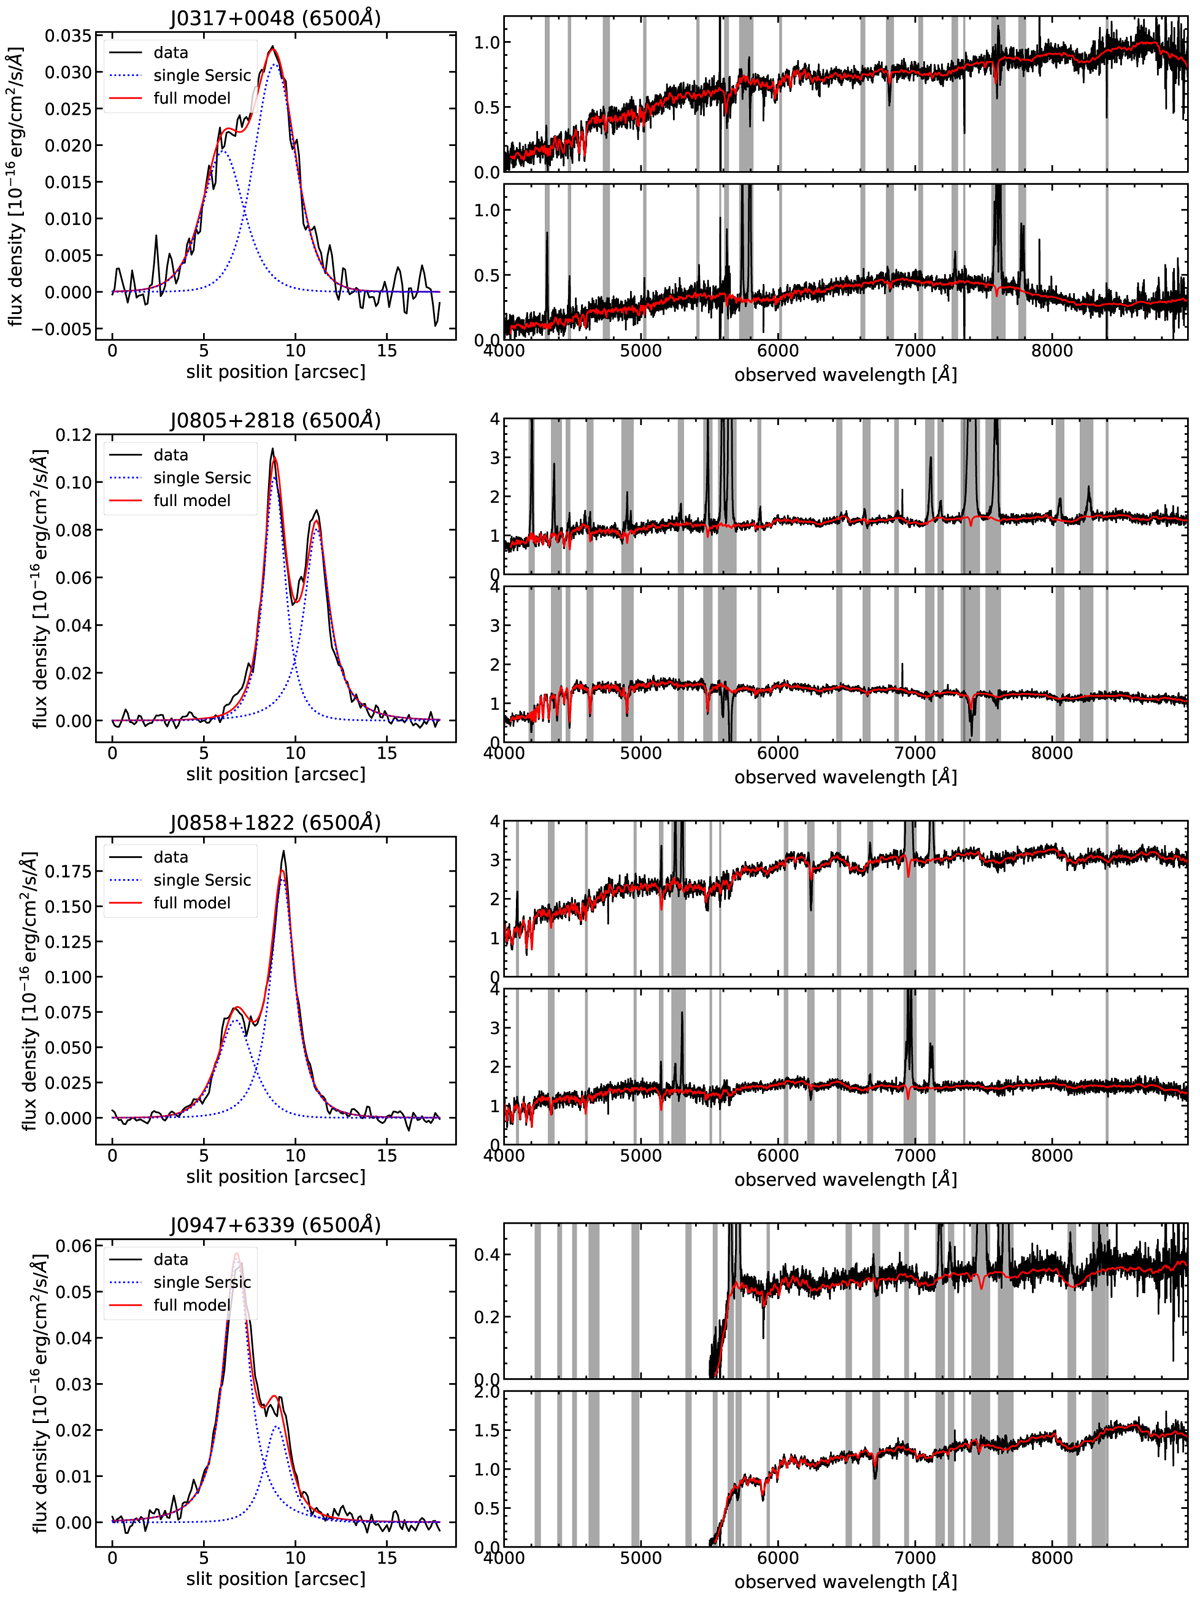
Overview of the continuum modelling. Left panel: cross-dispersion profile along the slit at 6500Å. Our best-fit two-component Sersic model convolved with the PSF is shown for comparison. Right panel: optimally extracted spectra of the two components (black line) assuming that the Sersic parameters only smoothly vary with wavelength. The red line represent the best-fit continuum model based on the INDO-US spectral library fitted with PyParadise. The grey shaded areas indicate the regions masked during the continuum fit.
Current usage metrics show cumulative count of Article Views (full-text article views including HTML views, PDF and ePub downloads, according to the available data) and Abstracts Views on Vision4Press platform.
Data correspond to usage on the plateform after 2015. The current usage metrics is available 48-96 hours after online publication and is updated daily on week days.
Initial download of the metrics may take a while.