Fig. 3.
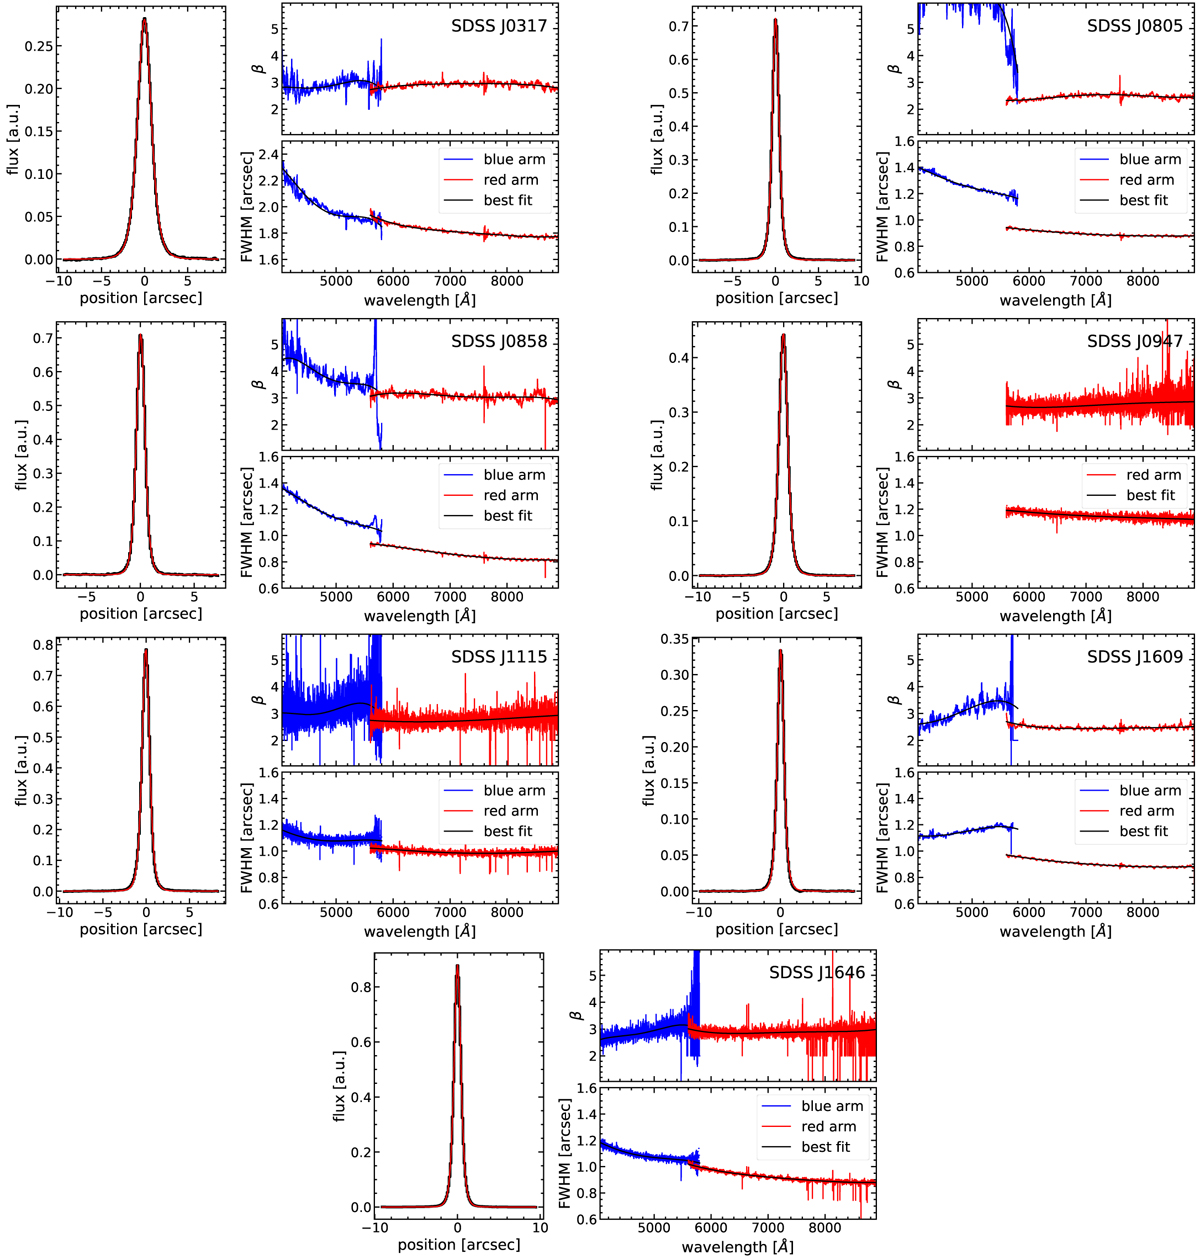
Analysis of the PSF from the star observations in each of the target fields. The cross-dispersion light profile at 6000Å is shown for each star with its best-fit 1D Moffat profile overplotted as the red line in the left panels. The measured β and FWHM Moffat shape parameters as a function of wavelength for the red and blue spectrograph arm are shown in the right panels. A fourth-order polynomial is fitted independently to both channels to smooth the wavelength dependence of the PSF parameters. The obvious breaks in the parameters between the two channels are likely caused by slightly different spectrograph focusing for the different observing nights and instruments.
Current usage metrics show cumulative count of Article Views (full-text article views including HTML views, PDF and ePub downloads, according to the available data) and Abstracts Views on Vision4Press platform.
Data correspond to usage on the plateform after 2015. The current usage metrics is available 48-96 hours after online publication and is updated daily on week days.
Initial download of the metrics may take a while.