Fig. 2.
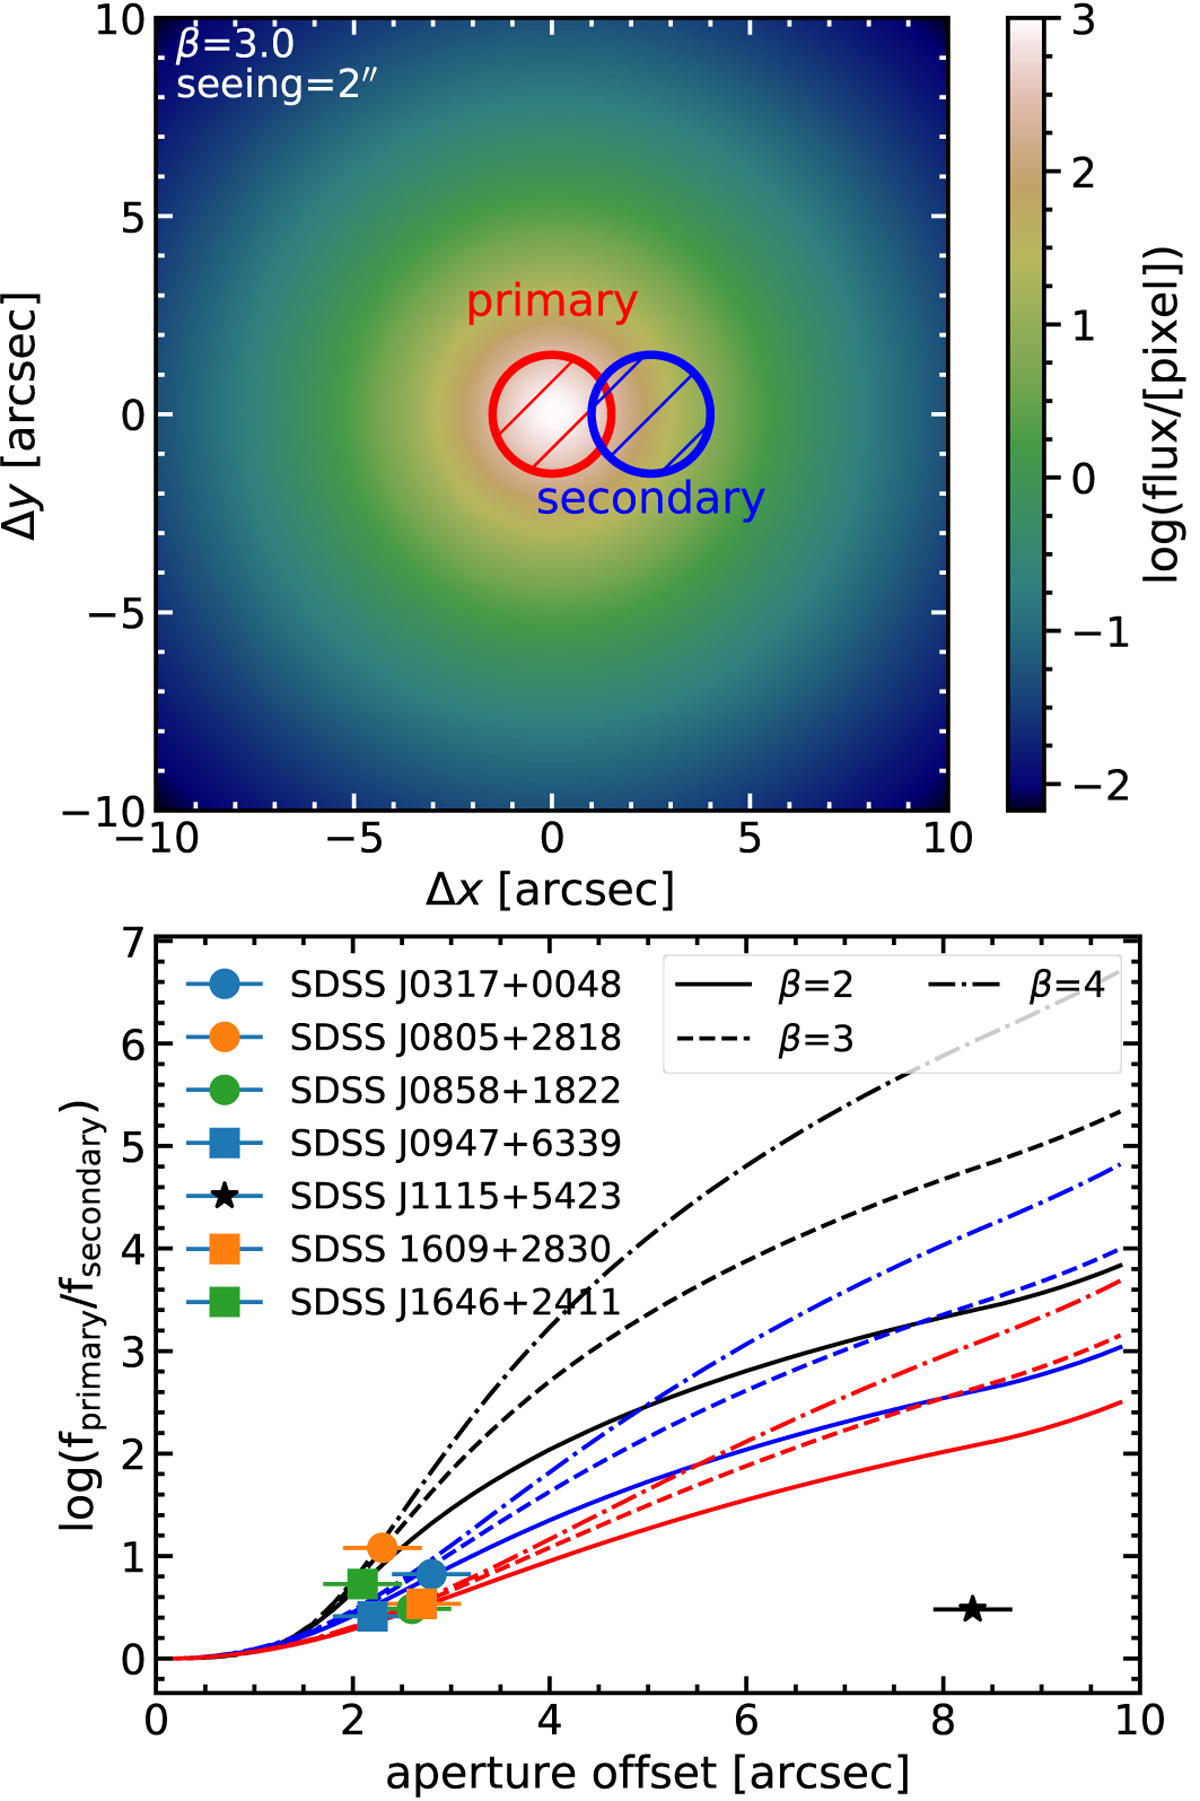
Theoretical expectations for flux ratio between primary and offset secondary SDSS fibre in the case of a point source. Top panel: logarithmic light distribution of a point source assuming a circular 2D Moffat function with β = 3 and seeing of 2″. The circles indicate the two independent SDSS fibres with a diameter of 3″ where the primary is centred on the target and the secondary is offset by 2![]() 5. Bottom panel: predictions for the flux ratios of the primary and secondary fibre for a point source as a function of secondary fibre distance to the point source. The curves are computed for three different seeing values of 1″ (black curves), 2″ (blue curves), and 3″ (red curves) with three different β values each as described in the legend. The measured [O III] λ5007 flux ratios for the six targets are shown as symbols; the error bar indicates the error on the combined fibre position uncertainty of 0
5. Bottom panel: predictions for the flux ratios of the primary and secondary fibre for a point source as a function of secondary fibre distance to the point source. The curves are computed for three different seeing values of 1″ (black curves), 2″ (blue curves), and 3″ (red curves) with three different β values each as described in the legend. The measured [O III] λ5007 flux ratios for the six targets are shown as symbols; the error bar indicates the error on the combined fibre position uncertainty of 0![]() 4 for the two fibres.
4 for the two fibres.
Current usage metrics show cumulative count of Article Views (full-text article views including HTML views, PDF and ePub downloads, according to the available data) and Abstracts Views on Vision4Press platform.
Data correspond to usage on the plateform after 2015. The current usage metrics is available 48-96 hours after online publication and is updated daily on week days.
Initial download of the metrics may take a while.