Fig. 7.
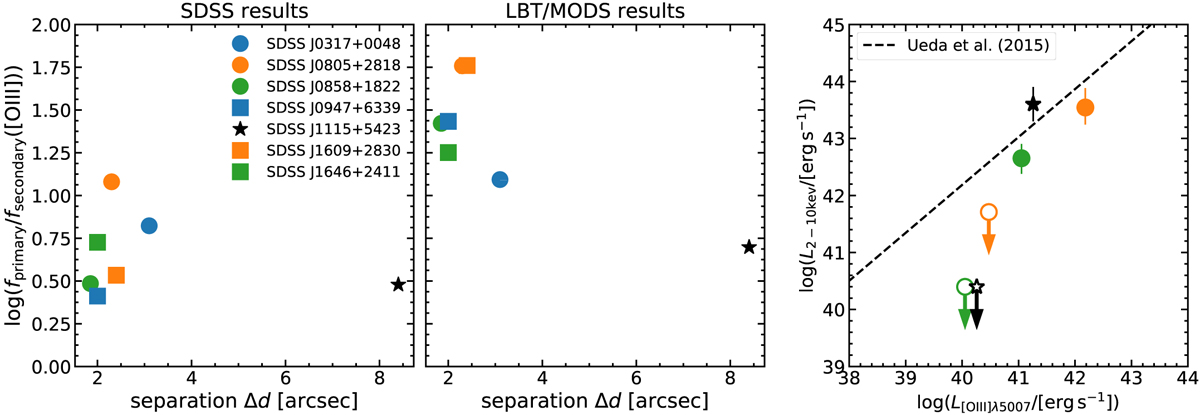
[O III] flux ratios based on SDSS (left panel) and LBT (middle panel) spectroscopy for the two nuclei as a function of separation. The 2–10 keV X-ray luminosities based on Chandra observations are compared to the [O III] luminosities for three of the sources in the right panel. The secondary nuclei are undetected in X-rays and 5σ upper limits on the X-ray luminosity are provided in these cases and shown as unfilled symbols. The dashed line shows the correlation determined by Ueda et al. (2015) for a large sample of obscured (type 2) AGN as a reference.
Current usage metrics show cumulative count of Article Views (full-text article views including HTML views, PDF and ePub downloads, according to the available data) and Abstracts Views on Vision4Press platform.
Data correspond to usage on the plateform after 2015. The current usage metrics is available 48-96 hours after online publication and is updated daily on week days.
Initial download of the metrics may take a while.