Fig. 1.
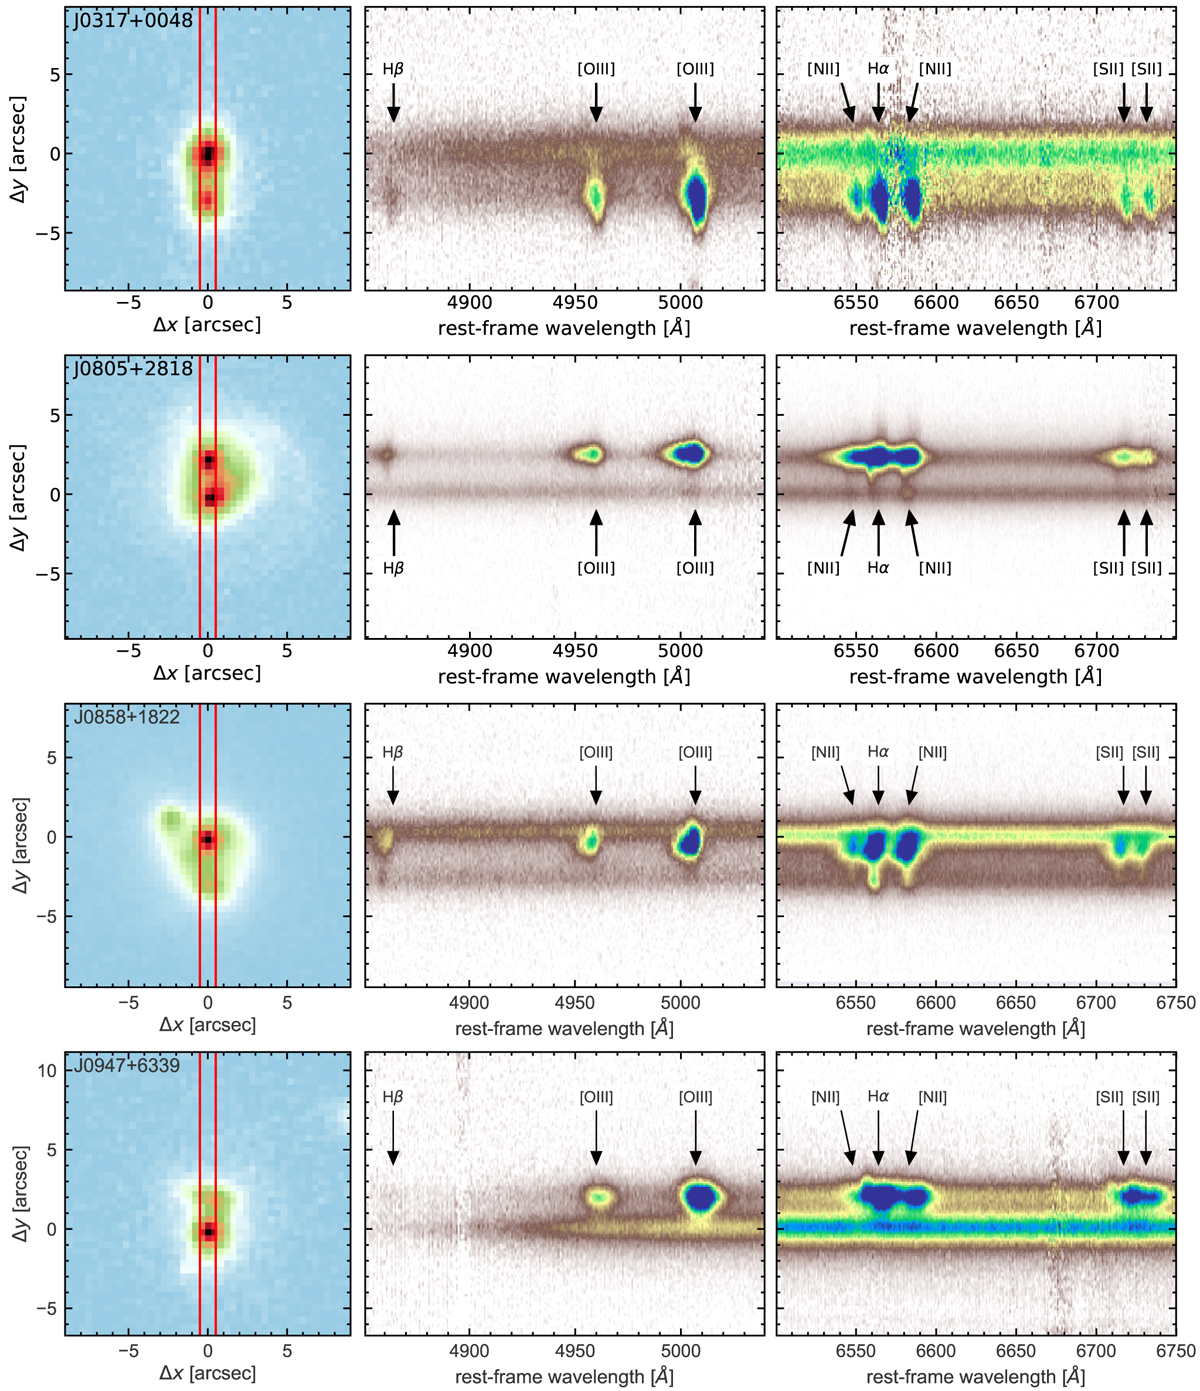
Overview of LBT slit observations for each target. Left panel: SDSS r-band image of the source rotated such that the slit is orientated in the vertical direction, as indicated by the two red lines. Right panels: cutout of the LBT MODS 2D spectra focused on the wavelength region covering the Hβ/[O III] and the Hα/[N II]/[S II] region. The emission lines are labelled.
Current usage metrics show cumulative count of Article Views (full-text article views including HTML views, PDF and ePub downloads, according to the available data) and Abstracts Views on Vision4Press platform.
Data correspond to usage on the plateform after 2015. The current usage metrics is available 48-96 hours after online publication and is updated daily on week days.
Initial download of the metrics may take a while.