Fig. 9.
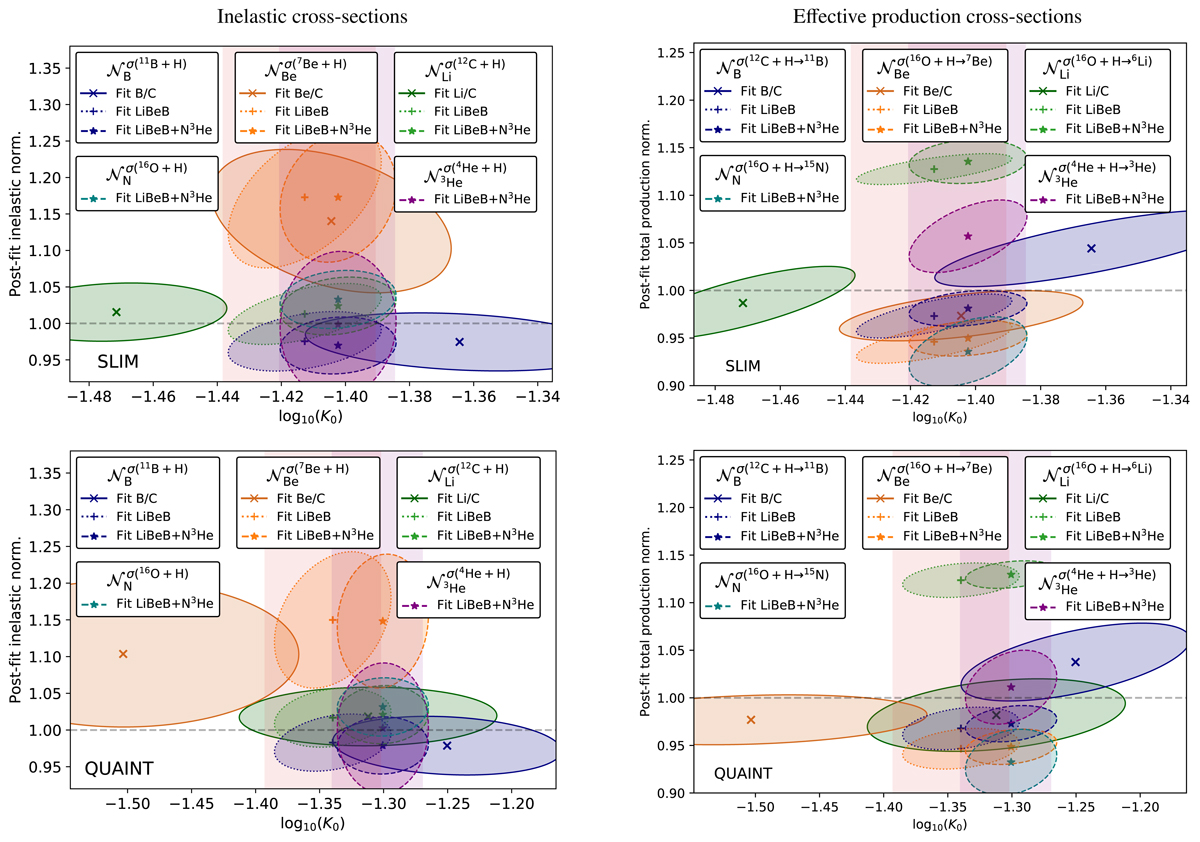
Correlations between the normalisation of the inelastic (left panels) or production (right panels) cross-sections and log10(K0), for models SLIM (top panels) and QUAINT (bottom panels). The various colours correspond to the normalisations of cross-sections involved in different CR species: Li (green), Be (orange), B (blue), N (turquoise), and 3He (crimson). The various symbols and line styles correspond to the post-fit values and ellipses (for the previously listed species) from various fit configurations: separate Li/C, Be/C, and B/C fits (“×” symbols and solid lines), combined Li/C, Be/C, and B/C fit (LiBeB for short, “+” symbols and dotted lines), combined LiBeB+N/O+3He+4He fit (“⋆” symbols and dashed lines). The horizontal grey dashed lines highlights the case of using unmodified cross-section datasets (T99 for inelastic and G17 for production, see Appendix B), i.e. ![]() : the subscript in 𝒩 indicates the CR species associated with this nuisance parameter; the superscript shows the reaction used as a proxy for this CR. For production cross-sections (right panels), the normalisation parameters are not directly the value of the nuisance parameter, but are effective parameters, see Eq. (11). See text for discussion.
: the subscript in 𝒩 indicates the CR species associated with this nuisance parameter; the superscript shows the reaction used as a proxy for this CR. For production cross-sections (right panels), the normalisation parameters are not directly the value of the nuisance parameter, but are effective parameters, see Eq. (11). See text for discussion.
Current usage metrics show cumulative count of Article Views (full-text article views including HTML views, PDF and ePub downloads, according to the available data) and Abstracts Views on Vision4Press platform.
Data correspond to usage on the plateform after 2015. The current usage metrics is available 48-96 hours after online publication and is updated daily on week days.
Initial download of the metrics may take a while.